Remember when antivirus software was the cause of every problem on devices? Workstation running slow? Disable AV. Server running slow, put in a heap of exclusions. Third party app not working, more exclusions. The thought of running multiple antivirus products on an endpoint was outrageous, and basically every vendor told you explicitly not to do it. Thankfully times change, due to a combination of smarter endpoint security products, more powerful computers and a willingness of Microsoft to work along side other vendors, that is no longer the case. Defender for Endpoint now happily sits behind other products in ‘passive mode’, like CrowdStrike Falcon, while still sending great data and integrating into apps like Cloud App Security, you can connect M365 to Sentinel with a native connector.
So if you are paying for a non Microsoft product like CrowdStrike or Carbon Black, you probably don’t want to send all the data from those products to Azure Sentinel as well, because a) you are paying for that privilege with your endpoint security vendor already, b) that product may either be managed by the vendor themselves, a partner and/or c) even if you manage it yourself, the quality of the native tooling in those products is part of the reason you pay the money for it and it doesn’t make a lot of sense to lift every event out of there, into Sentinel and try and recreate the wheel.
What we can do though is send some low volume, but high quality data into Sentinel to jump start further investigations or automations based on other data we have in there – the logs from Defender for Endpoint in passive mode, the SecurityAlert table from things like Azure Security Center or Defender for ID, Azure AD sign in logs etc. So for CrowdStrike, in this example, we are just going to send a webhook to Sentinel each time a detection is found, then ingest that into a custom table using a simple Logic App so we can expand our hunting. Hopefully you don’t get too many detections, so this data will basically cost nothing.
On the Azure Sentinel side we first create a new Logic App with the ‘When a HTTP request is received’ trigger, once you save it you will be given your webhook URL. Grab that address then head over to CrowdStrike and create your notification workflow, which is a simple process outlined here.

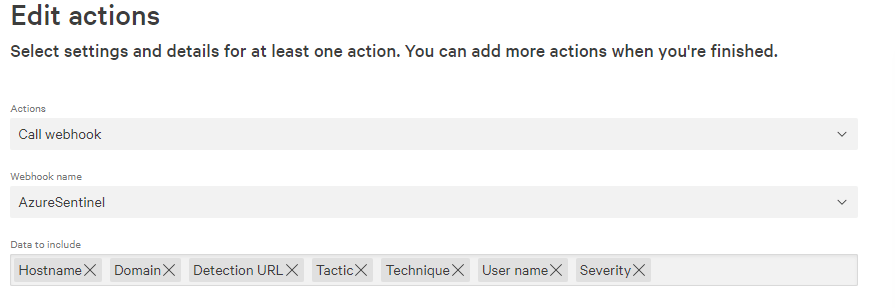
For the actions, we are just going to call our webhook and send the following data on each new detection.
Now each time a detection is created in CrowdStrike Falcon it will send the data to our Logic App. The last part is to configure the Logic App to then push that data to Azure Sentinel which we do with three quick actions. First, we parse the JSON that is inbound from CrowdStrike, if you are using the same data as myself then the schema for this is –
{
    "properties": {
        "data": {
            "properties": {
                "detections.severity": {
                    "type": "string"
                },
                "detections.tactic": {
                    "type": "string"
                },
                "detections.technique": {
                    "type": "string"
                },
                "detections.url": {
                    "type": "string"
                },
                "detections.user_name": {
                    "type": "string"
                },
                "devices.domain": {
                    "type": [
                        "string",
                        "null"
                    ]
                },
                "devices.hostname": {
                    "type": "string"
                }
            },
            "type": "object"
        },
        "meta": {
            "properties": {
                "event_reference_url": {
                    "type": "string"
                },
                "timestamp": {
                    "type": "integer"
                },
                "trigger_name": {
                    "type": "string"
                },
                "workflow_id": {
                    "type": "string"
                }
            },
            "type": "object"
        }
    },
    "type": "object"
}
Then we are going to compose a new JSON payload where we change the column headers to something a little easier to read, then send that data to Sentinel using the ‘Send data’ action. So our entire ingestion playbook is just four steps.
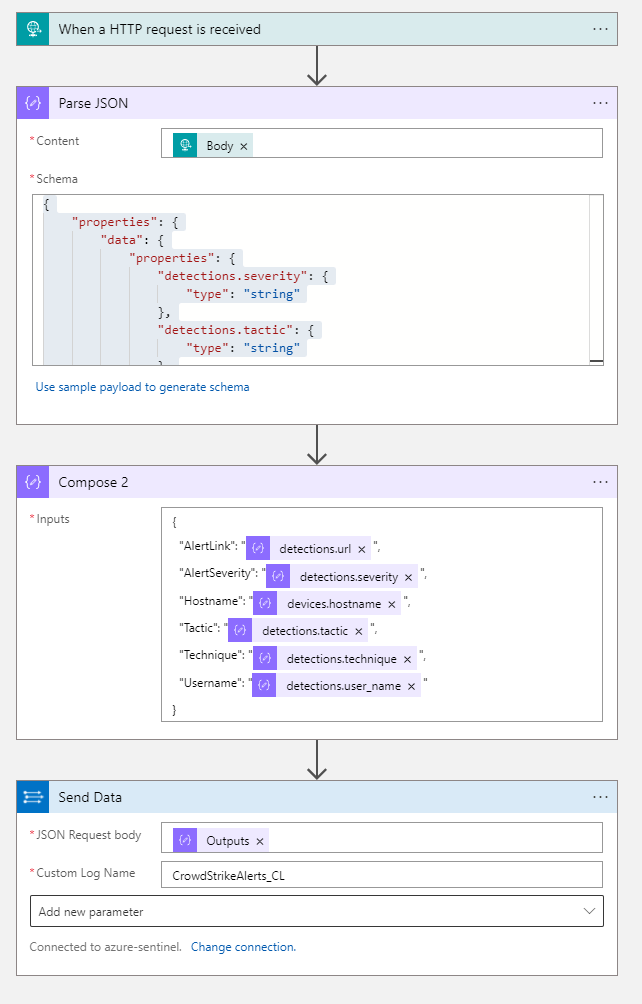
You can create test detections by following the CrowdStrike support article. You should see alerts start to flow in to your CrowdStrikeAlerts_CL.

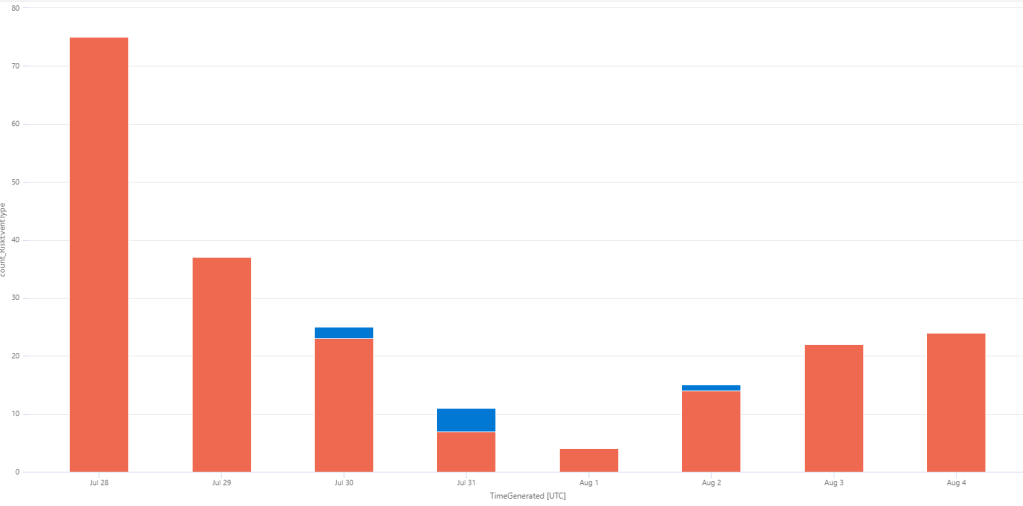
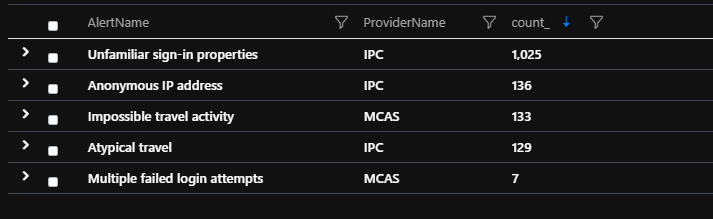
Once you have some data in there you can start visualizing trends in your data, what types of techniques are being seen –
CrowdStrikeAlerts_CL
| summarize count()by Technique_s
| render piechart 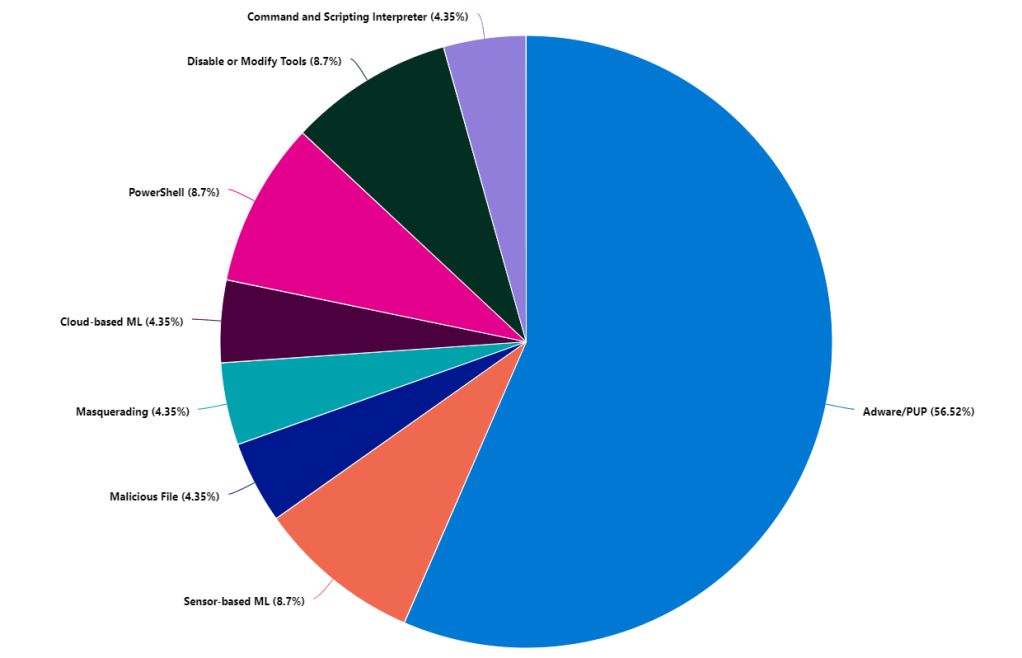
Where the real value is with getting these detections into Sentinel is leveraging all the other data already in there and then automating response. One of the most simple things is to take the username from your alert and join it to your IdentifyInfo table (powered by UEBA) and find out some more information about the user. Your Azure AD identity information is highly likely to be of greater quality than almost anywhere else. So grab your alert, join it to your identity table grabbing the most recent record for the user –
CrowdStrikeAlerts_CL
| project Hostname_s, AlertSeverity_s, Technique_s, Username_s, AlertLink_s
| join kind=inner
(
IdentityInfo
| where TimeGenerated > ago(21d)
| summarize arg_max(TimeGenerated, *) by AccountName
)
on $left.Username_s == $right.AccountName
| project Hostname_s, AlertSeverity_s, Technique_s, Username_s, AccountUPN, Country, EmployeeId, Manager, AlertLink_s
Now on our alerts we get not only the info from CrowdStrike but the information from our IdentityInfo table, so where the user is located, their UPN, manager and whatever else we want.
We can use the DeviceLogonEvents from Defender to find out if the user is a local admin on that device. You may want to prioritize those detections because there is greater chance of damage being done and lateral movement when the user is an admin –
let csalert=
CrowdStrikeAlerts_CL
| where TimeGenerated > ago (1d)
| project HostName=Hostname_s, AccountName=Username_s, Technique_s, AlertSeverity_s;
DeviceLogonEvents
| where TimeGenerated > ago (1d)
| join kind=inner csalert on HostName, AccountName
| where LogonType == "Interactive"
| where InitiatingProcessFileName == "lsass.exe"
| summarize arg_max(TimeGenerated, *) by DeviceName
| project TimeGenerated, DeviceName, IsLocalAdmin
If a user is flagged using suspicious PowerShell, we can grab the alert, then find any PowerShell events in a 30 minute window (15 mins either side of your alert). When you are joining different tables you just need to check how each table references your device names. You may need to trim or adjust the naming so they match up. You can use the tolower function to drop everything to lower case and trim(@”.yourdomain.com”,DeviceName) if you need to remove your domain name in order to match.
let csalert=
CrowdStrikeAlerts_CL
| where TimeGenerated > ago(1d)
| extend AlertTime = TimeGenerated
| where Technique_s == "PowerShell"
| project AlertTime, Hostname_s, AlertSeverity_s, Technique_s, Username_s;
DeviceProcessEvents
| where TimeGenerated > ago(1d)
| join kind=inner csalert on $left.DeviceName == $right.Hostname_s
| where InitiatingProcessFileName contains "powershell"
| where TimeGenerated between ((AlertTime-timespan(15min)).. (AlertTime+timespan(15min)))
We can look up the device which flagged a CrowdStrike detection and see if it has been flagged elsewhere in SecurityAlert table, maybe by Defender for ID or another product you have. Again, just check out the structure of your various tables as your naming may not be exactly the same but use your trim and other functions to line them up.
let csalert=
CrowdStrikeAlerts_CL
| where TimeGenerated > ago(4d)
| project Hostname_s, AlertSeverity_s, Username_s
| join kind=inner (
IdentityInfo
| where TimeGenerated > ago(21d)
| summarize arg_max(TimeGenerated, *) by AccountName)
on $left.Username_s == $right.AccountName
| project Hostname_s, AlertSeverity_s, Username_s, AccountUPN;
SecurityAlert
| where TimeGenerated > ago (7d)
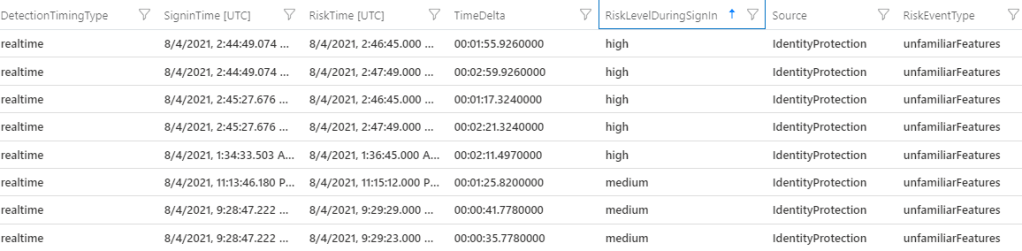
| join kind=inner csalert on $left.CompromisedEntity == $right.Hostname_sAnd the same for user alerts, possibly from your identity products like Azure AD Identity Protection or Cloud App Security. We can use our identity table to make sense of different types of usernames these products may use. CrowdStrike or your AV may use samaccountname, where Cloud App uses userprincipalname for instance.
let csalert=
CrowdStrikeAlerts_CL
| where TimeGenerated > ago(4d)
| project Hostname_s, AlertSeverity_s, Username_s
| join kind=inner (
IdentityInfo
| where TimeGenerated > ago(21d)
| summarize arg_max(TimeGenerated, *) by AccountName)
on $left.Username_s == $right.AccountName
| project Hostname_s, AlertSeverity_s, Username_s, AccountUPN;
SecurityAlert
| where TimeGenerated > ago (7d)
| join kind=inner csalert on $left.CompromisedEntity == $right.AccountUPN
It’s great being alerted to things and having information available to investigate, but sometimes an alert is of a high enough priority that you want to respond to it automatically. With CrowdStrike, the team have built a few playbooks we can leverage, which are located here. The three we are interested in are CrowdStrike_base which handles authentication to their API, CrowdStrike_Enrichment_GetDeviceInformation which retrieves host information about a device and finally CrowdStrike_ContainHost which will network contain a device for us. This playbook works by retrieving the hostname from the Sentinel entity mapping, searching CrowdStrike for a matching asset and containing it. Deploy the base playbook first, because the other two depend on it to access the API. You will also need an API key from your CrowdStrike tenant with enough privilege.
Once deployed you can either require someone to run the playbook manually or you can automate it entirely. For alerts that come in from CrowdStrike, or other AV products there is a good chance you already have the rules set up to determine response to detections. However we can use the same playbook to contain devices that we find when hunting through log data that CrowdStrike don’t see. For instance Defender for ID is going to be hunting for different threats than an endpoint security product. CrowdStrike may not generally care about domain recon or it may not detect pass the hash type activity, but Defender for ID definitely will. If we want to network contain based on domain recon flagged by Defender for ID we parse out the entities from the alert, then we can trigger our playbook based on that. We want to exclude our domain controllers from the entities, because they are the target of the attack and we don’t want to contain those, but we do the endpoint initiating the behaviour.
SecurityAlert
| where ProviderName contains "Azure Advanced Threat Protection"
| where AlertName contains "reconnaissance"
| extend EntitiesDynamicArray = parse_json(Entities) | mv-expand EntitiesDynamicArray
| extend EntityType = tostring(parse_json(EntitiesDynamicArray).Type), EntityAddress = tostring(EntitiesDynamicArray.Address), EntityHostName = tostring(EntitiesDynamicArray.HostName)
| extend HostName = iif(EntityType == 'host', EntityHostName, '')
| where HostName !contains "ADDC" and isnotempty(HostName)
| distinct HostName, AlertName, VendorOriginalId, ProviderName
You can also grab identity alerts, such as ‘Mass Download’, lookup your DeviceLogonEvents table to find the machine most recently used by the person who triggered it, then isolate the host based off that. Our SecurityAlert table uses userprincipalname and our DeviceLogonEvents uses the old style username, so we again use our IdentityInfo table to piece them together.
let alert=
SecurityAlert
| where AlertName has "Mass Download"
| project CompromisedEntity
| join kind=inner
(
IdentityInfo
| where TimeGenerated > ago (21d)
| summarize arg_max (TimeGenerated, *) by AccountUPN
)
on $left.CompromisedEntity == $right.AccountUPN
| project CompromisedEntity, AccountUPN, AccountName;
DeviceLogonEvents
| where TimeGenerated > ago (1d)
| join kind=inner alert on AccountName
| where LogonType == "Interactive"
| where InitiatingProcessFileName == "lsass.exe"
| summarize arg_max(TimeGenerated, *) by DeviceName
| project DeviceName, CompromisedEntity, AccountName
Most identity driven alerts from Cloud App Security or Azure AD Identity Protection won’t actually have the device name listed, we leverage our other data to go find it. Now we have the device name which our user last logged onto for our ‘Mass Download’ events, we can isolate the machine, or at the very least investigate further. Of course the device we found may not necessarily be the one that has flagged the alert – but you may want to play it safe and contain it anyway while also responding to the identity side of the alert.