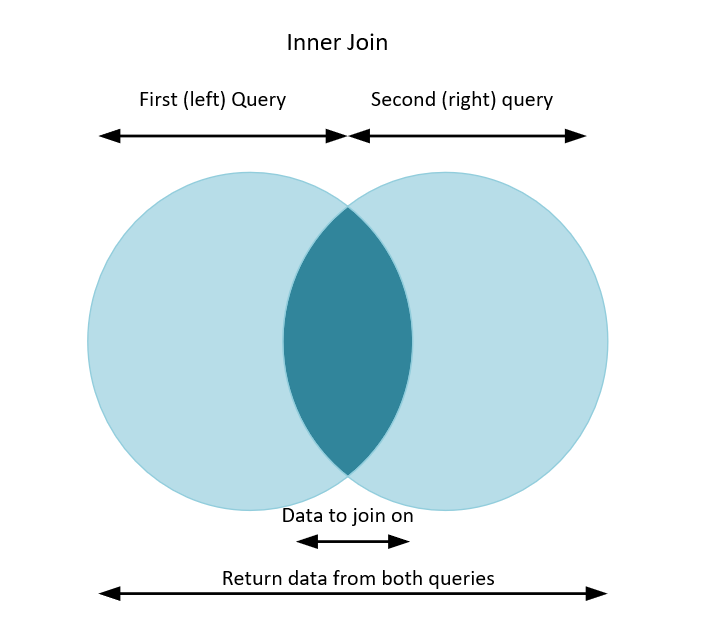
One of the more difficult things to learn in KQL (apart from joining tables together) is how to deal with multi-value sets of data. If you work in particular types of data, such as Azure AD sign in data, or Security Alert data, you will see lots of these data sets too. There is no avoiding them. What do I mean by multi-value? We are talking about a set of data that is a JSON array and has multiple objects within it. Those objects may even have further nested arrays. It can quickly get out of hand and become difficult to make sense of.
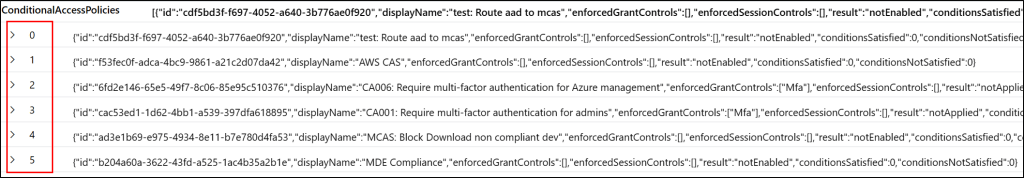
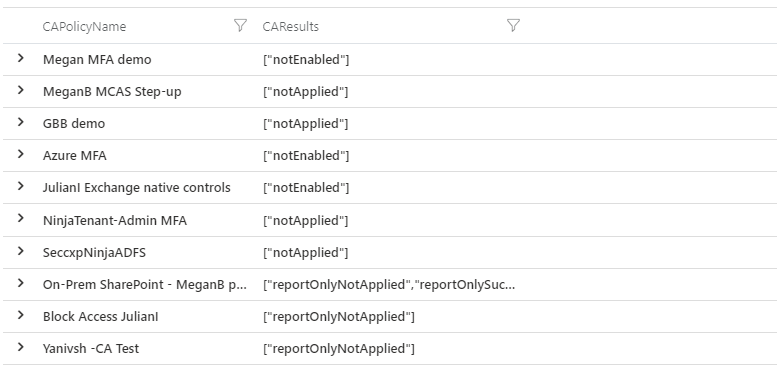
Let’s look at an example. Azure AD Conditional Access policies. Each time you sign into Azure AD, it will evaluate all the policies in your tenant. Some it will apply, and maybe enforce MFA, some may not be applied because you aren’t in scope of the policy. Others may be in report only mode or be disabled entirely. At the end of your sign in, the logs will show the outcome of all your policies. The data looks a bit like this:
We get this massive JSON array, then within that we get an object for each policy, showing the relevant outcome. In this example we have 6 policies, starting from 0. Within each object, you may have further arrays, such as the ‘enforcedGrantControls’. This is because a policy may have multiple controls, such as requiring MFA and a compliant device.
You can have a look in your own tenant simply enough by looking at just the Conditional Access data.
SigninLogs
| take 10
| project ConditionalAccessPolicies
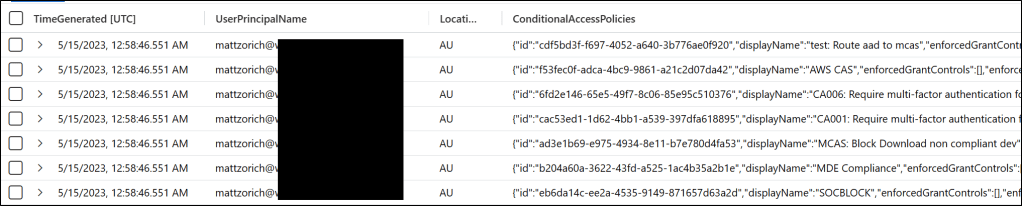
Where multi-value data can get tricky is that the order of the data, or the location of particular data can change. If we again take our Conditional Access data, it can change order depending on the outcome of the sign in. Any policies that are successful, such as a user completing MFA, or a policy that failed, by a user failing MFA, will be moved to the top of the JSON array.
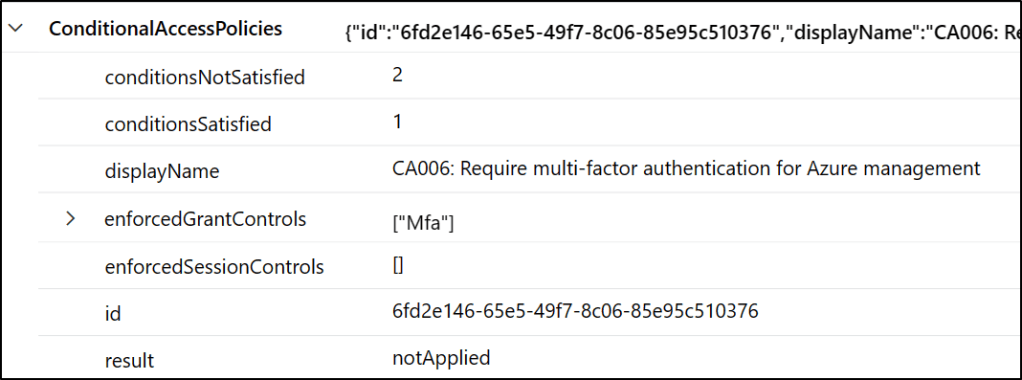
So, when I successfully complete MFA on an Azure management web site, the ‘CA006: Require multi-factor authentication for Azure management’ (as seen above) policy will go to the top of the array. When I sign into something other than Azure, that policy will be ‘notApplied’ and be in a different location within the array.
Why is this a problem? KQL is very specific, so if we want to run an alert when someone fails ‘CA006: Require multi-factor authentication for Azure management’ we need to make sure our query is accurate. If we right-click on our policy and do the built-in ‘Include’ functionality in Sentinel:
It gives us the following query:
SigninLogs
| project ConditionalAccessPolicies
| where ConditionalAccessPolicies[3].displayName == "CA006: Require multi-factor authentication for Azure management"
We can see in this query that we are looking for when ConditionalAccessPolicies[3].displayName == “CA006: Require multi-factor authentication for Azure management”. The [3] indicated shows that we are looking for the 4th object in our array (we start counting at 0). So, what happens when someone fails this policy? It will move up the JSON array into position 0, and our query won’t catch it.
So how do we deal with these kinds of data? I present to you, mv-expand and mv-apply.
mv-expand
mv-expand, or multi-value expand, at its most basic, takes a dynamic array of data and expands it out to multiple rows. When we use mv-expand, KQL expands out the dynamic data, and simply duplicates any non-dynamic data. Leaving us with multiple rows to use in our queries.
mv-expand is essentially the opposite of summarize operators such as make_list and make_set. With those we are creating arrays, mv-expand we are reversing that, and expanding arrays.
As an example, let’s find the sign-in data for my account. In the last 24 hours, I have had 3 sign-ins into this tenant.
Within each of those, as above, we have a heap of policies that are evaluated.
I have cut the screenshot off for the sake of brevity, but I can tell you that in this tenant 22 policies are evaluated on each sign in. Now to see what mv-expand does, we add that to our query.
If we run our query, we will see each policy will be expanded out to a new record. The timestamp, location and username are simply duplicated, because they are not dynamic data. In my tenant, I get 22 records per sign in, one for each policy.
If we look at a particular record, we can see the Conditional Access policy is no longer positional within a larger array, because we have a separate record for each entry.
Now, if we are interested in our same “CA006: Require multi-factor authentication for Azure management” policy, and any events for that. We again do our right-click ‘Include’ Sentinel magic.
We will get the following query
SigninLogs
| project TimeGenerated,UserPrincipalName, Location, ConditionalAccessPolicies
| mv-expand ConditionalAccessPolicies
| where ConditionalAccessPolicies.displayName == "CA006: Require multi-factor authentication for Azure management"
This time our query no longer has the positional [3] we saw previously. We have expanded our data out and made it more consistent to query on. So, this time if we run our query, we will get a hit for every time the policy name is “CA006: Require multi-factor authentication for Azure management”, regardless of where in the JSON array it is. When we run that query, we get 3 results, as we would expect. One policy hit per sign in for the day.
Once you have expanded your data out, you can then create your hunting rules knowing the data is in a consistent location. So, returning to our original use case, if we want to find out where this particular policy is failing, this is our final query:
So, we have used mv-expand to ensure our data is consistent, and then looked for failures on that particular policy.
And we can see, we have hits on that new hunting query.
mv-apply
mv-apply, or multi-value apply adds to mv-expand, by allowing you to create a sub-query, and then returning the results. So, what does that actually mean? mv-apply actually runs mv-expand initially but gives us more freedom to create an additional query before returning the results. mv-expand is kind of like a hammer, we will just expand everything out and deal with it later. mv-apply gives us the ability to filter and query the expanded data, before returning it.
The syntax for mv-apply can be a little tricky to start with. To make things easy, let’s use our same data once again. Say we are interested in the Conditional Access stats for any policy that references ‘Azure’ or ‘legacy’ (for legacy auth), or any policy that has failures associated with it.
We could do an mv-expand as seen earlier, or we can use mv-apply to create that query during the expand.
SigninLogs
| project TimeGenerated,UserPrincipalName, Location, ConditionalAccessPolicies
| mv-apply ConditionalAccessPolicies on
(
where ConditionalAccessPolicies.displayName has_any ("Azure","legacy") or ConditionalAccessPolicies.result == "failure"
| extend CADisplayName=tostring(ConditionalAccessPolicies.displayName)
| extend CAResult=tostring(ConditionalAccessPolicies.result)
)
| summarize count() by CADisplayName, CAResult
So, for mv-apply, we start with mv-apply on. After that we create our subquery. Our sub-query is defined in the ( and ) seen after mv-apply. Interestingly, and quite unusual for KQL, is that the first line of the sub query does not require a | to precede it. Subsequent lines within the subquery do require it, as usual with KQL.
In this query we are looking for any policy names with ‘Azure’ or ‘legacy’ in them, or where the result is a failure. Then our query says if there is match on any of those conditions, then extend out our display name and result to new columns. Then finally we can summarize our data to provide some stats.
We are returned only the stats for matches of our sub-query. Either where the policy name has ‘Azure’ or ‘legacy’ or where the result is a failure.
Think of mv-apply as the equivalent of a loop statement through your expanded data. As it runs through each loop or row of data, it applies your query to each row.
It is important to remember order of operations when using mv-apply, if you summarize data inside the mv-apply ‘loop’ it will look much different to when you do it after the mv-apply has finished. Because it is within the ‘loop’, it will summarize it for every row of expanded data.
mv-apply is particularly valuable when dealing with JSON arrays that have additional arrays within them. You can mv-apply multiple times to get to the data you are interested in. On each loop, you can filter your query. Using a different data set, we can see an example of this. In the Azure AD audit logs, there is very often a quite generic event called ‘Update user’. This can be triggered on numerous things: name or licensing changes, email address updates or changes to MFA details etc.
In a lot of Azure AD audit logs, the interesting data is held in the ‘targetResources’ field. However, beneath that is a field called ‘modifiedProperties’. The modifiedProperties field has the detail of what actually changed on the user.
AuditLogs
| where TimeGenerated > ago(90d)
| where TargetResources has "PhoneNumber"
| where OperationName has "Update user"
| where TargetResources has "StrongAuthenticationMethod"
| extend InitiatedBy = tostring(parse_json(tostring(InitiatedBy.user)).userPrincipalName)
| extend UserPrincipalName = tostring(TargetResources[0].userPrincipalName)
| extend targetResources=parse_json(TargetResources)
| mv-apply tr = targetResources on (
    extend targetResource = tr.displayName
    | mv-apply mp = tr.modifiedProperties on (
    where mp.displayName == "StrongAuthenticationUserDetails"
    | extend NewValue = tostring(mp.newValue)
    ))
| project TimeGenerated, NewValue, UserPrincipalName,InitiatedBy
| mv-expand todynamic(NewValue)
| mv-expand NewValue.[0]
| extend AlternativePhoneNumber = tostring(NewValue.AlternativePhoneNumber)
| extend Email = tostring(NewValue.Email)
| extend PhoneNumber = tostring(NewValue.PhoneNumber)
| extend VoiceOnlyPhoneNumber = tostring(NewValue.VoiceOnlyPhoneNumber)
| project TimeGenerated, UserPrincipalName, InitiatedBy,PhoneNumber, AlternativePhoneNumber, VoiceOnlyPhoneNumber, Email
| where isnotempty(PhoneNumber)
| summarize ['Count of Users']=dcount(UserPrincipalName), ['List of Users']=make_set(UserPrincipalName) by PhoneNumber
| sort by ['Count of Users'] desc
In this example, we use mv-apply to find where the displayName of the modifiedProperties is ‘StrongAuthenticationUserDetails’. This indicates a change to MFA details, perhaps a new phone number has been registered. This particular query then looks for when it is indeed a phone number change. It then summarizes the number of users registered to the same phone number. This query is looking for Threat Actors that are registering the same MFA number to multiple users.
By using a ‘double’ mv-apply, we filter out all the ‘Update user’ events that we aren’t interested in, and focus down on the ‘StrongAuthenticationUserDetails’ events. We don’t get updates to say licensing events, that would be captured more broadly in an ‘Update user’ event.
Summary
mv-apply and mv-expand are just a couple of the ways to extract dynamic data in KQL. There are additional operators, such as bag_unpack, and even operators for other data types, such as parse_xml. I find myself coming constantly back to mv-expand and mv-apply, mostly because of the ubiquitousness of JSON in security products.
I am a very visual person. When looking at data I love to look at the trend of that data and see if it tells a story. If you are using Sentinel, Log Analytics or Azure Data Explorer this can be particularly important. Those platforms can handle an immense amount of data and making sense of it can be overwhelming. Luckily KQL arms us with a lot of different ways to turn our data into visualizations. There are some subtle differences between the capabilities of Azure Monitor (which drives Sentinel) and Azure Data Explorer with visualizations. Check out the guidance here for Azure Data Explorer and here for Azure Monitor (Log Analytics and Sentinel).
In order to produce any kind of visualization in KQL, first we need to summarize our data. I like to separate the styles of visualizations into two main types. First, we have non time visualizations, that is just when we want to produce a count of something and then display it. Secondly, we have time-based visualizations, and that is when we want to visualize our data over a time period. With those we can see how our data changes over time.
Regular Visualizations
For all these examples, we will use our Azure Active Directory sign in logs. That data is full of great information you may want to visualize. Applications, MFA methods, location data, all those and more are stored in our sign in data, and we can use any of them (or combinations of them) as a base for our visuals.
Let’s start simply. We can see the most popular applications in our tenant by doing a simple count. The following query will do that for you.
SigninLogs
| where TimeGenerated > ago(30d)
| where ResultType == 0
| summarize Count=count() by AppDisplayName
Now you will see you are output a table of data.
To turn that into a visualization, we use our render operator. Now you can also do this by clicking in the UI itself on ‘Chart’ and then choosing our options. That isn’t fun though, we want to learn how to do it ourselves. It is also simple; we just need to tell KQL what type of visual we want. To build a standard pie chart we just add one more line to our query.
SigninLogs
| where TimeGenerated > ago(30d)
| where ResultType == 0
| summarize Count=count() by AppDisplayName
| render piechart
With these kind of counts in order to make them display a little ‘cleaner’, I would recommend ordering them first. That way they will display consistently. Depending on how much data you have, you may also want to limit the results. Otherwise, you may just have too many results in there and it becomes hard to read. We can achieve both of those by adding a single line to our query. We tell KQL to take the top 10 results by the count. Then again render our pie chart.
SigninLogs
| where TimeGenerated > ago(30d)
| where ResultType == 0
| summarize Count=count() by AppDisplayName
| top 10 by Count
| render piechart
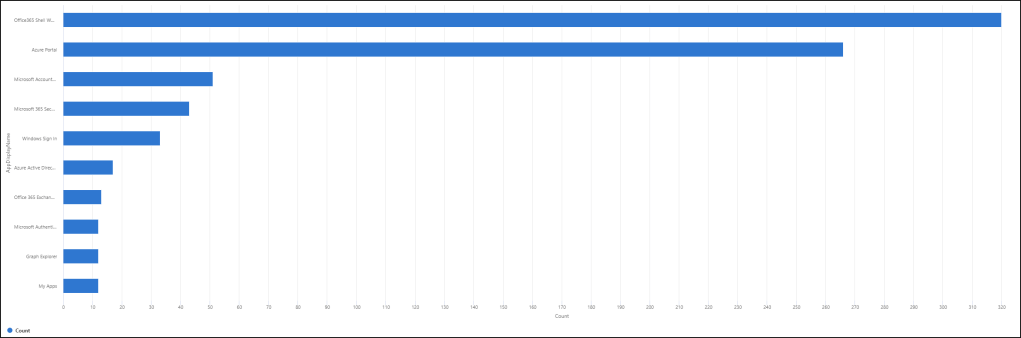
In my opinion this cut down version is much easier to make sense of. If you don’t want to use a pie chart, you can use bar or column charts too. Depending on your data, you may want to pick one over the other. I personally find column and bar charts are a little easier to understand than pie charts. They are also better at giving context because they show the scale a little better.
We can see the same query visualized as a bar chart.
SigninLogs
| where TimeGenerated > ago(30d)
| where ResultType == 0
| summarize Count=count() by AppDisplayName
| where isnotempty( AppDisplayName)
| top 10 by Count
| render barchart
And a column chart.
SigninLogs
| where TimeGenerated > ago(30d)
| where ResultType == 0
| summarize Count=count() by AppDisplayName
| where isnotempty( AppDisplayName)
| top 10 by Count
| render columnchart
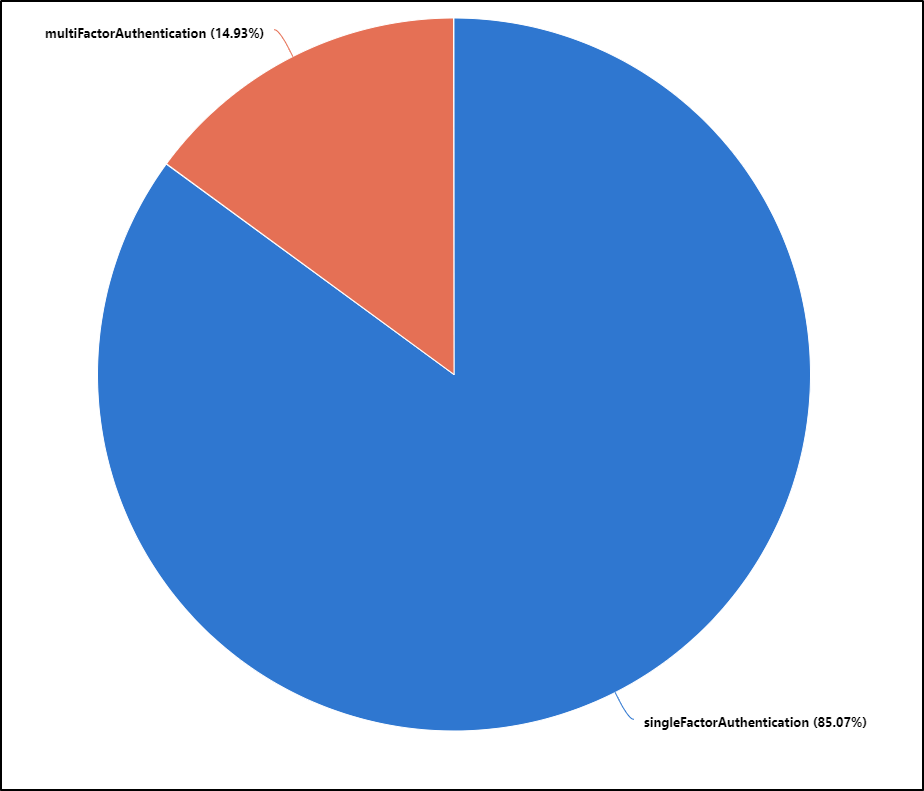
In these examples we can really see the different between our top 2 results, and everything else. Some other examples you may find useful in your Azure AD logs are single vs multifactor authentication requirement on sign in.
SigninLogs
| where TimeGenerated > ago(30d)
| where ResultType == 0
| summarize Count=count() by AuthenticationRequirement
| render piechart
We can dig even deeper and look at types of MFA being used.
SigninLogs
| where TimeGenerated > ago(150d)
| where AuthenticationRequirement == "multiFactorAuthentication"
| mv-expand todynamic(AuthenticationDetails)
| extend ['Authentication Method'] = tostring(AuthenticationDetails.authenticationMethod)
| where ['Authentication Method'] !in ("Password","Previously satisfied")
| summarize Count=count()by ['Authentication Method']
| where isnotempty(['Authentication Method'])
| sort by Count desc
| render piechart
This would show you the breakdown of the different MFA types in your tenant such as mobile app notification, text message, phone call, Windows Hello for Business etc.
You can even see the different locations accessing your Azure AD tenant.
SigninLogs
| where TimeGenerated > ago(30d)
| where ResultType == 0
| summarize Count=count() by Location
| top 10 by Count
| render columnchart
Have a play with the different types to see which works best for you. Pie charts can be better when you have fewer types of results. For instance, the single vs multifactor authentication pie chart really tells you a great story about MFA coverage in this tenant.
Time series visualizations
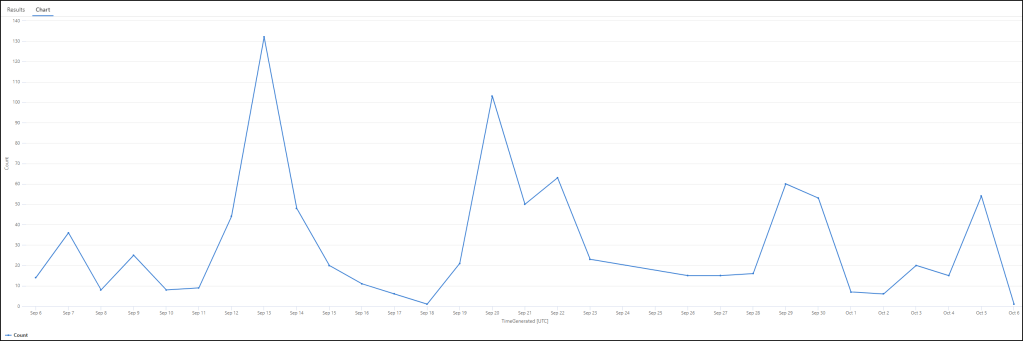
Time series visualizations build on that same work, though this time we need to add a time bucket or bin to our data summation. Which makes sense if you think about it. To tell KQL to visualize something over a time period, we need to put our data into bins of time. So then when it displays, we can see how it looks over a long time period. We can choose what size we want those bins to be. Maybe we want to look at 30 days of data total, then break that into one day bins. Let’s start basic again, and just look at total successful sign ins to our tenant per day over the last 30.
SigninLogs
| where TimeGenerated > ago(30d)
| where ResultType == 0
| summarize Count=count() by bin(TimeGenerated, 1d)
| render timechart
We can see in our query we are looking back 30 days, then we are putting our results into 1-day bins of time. Our resulting visual shows how that data looks over the period.
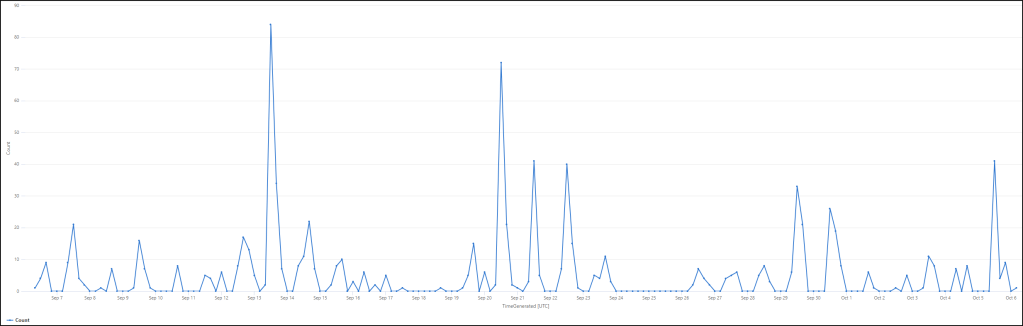
If you wanted to reduce the time period of each bin, you can. You could reduce the bin time down to say 4 hours, or 30 minutes. Here is the same data, but with 4-hour time bins instead of 1 day.
SigninLogs
| where TimeGenerated > ago(30d)
| where ResultType == 0
| summarize Count=count() by bin(TimeGenerated, 4h)
| render timechart
There are no more or less sign ins to our tenant, we are just sampling the data more frequently to build our visual.
You can even use more advanced data aggregation and summation before your visual. You can for instance take a count of both the total sign ins and the distinct user sign ins and visualize both together. We then query both over the same 4-hour time period and can see both on the same visual.
SigninLogs
| where TimeGenerated > ago(30d)
| where ResultType == 0
| summarize Count=count(), ['Distinct Count']=dcount(UserPrincipalName) by bin(TimeGenerated, 4h)
| render timechart
Now we can see total sign ins in blue and distinct user sign ins in orange, over the same time period. Another great example is using countif(). For instance, we can maybe look at sign ins from the US vs those not in the US. We do a countif where the location equals US and again for when it doesn’t equal the US.
SigninLogs
| where TimeGenerated > ago(30d)
| where ResultType == 0
| summarize US=countif(Location == "US"), NonUS=countif(Location != "US") by bin(TimeGenerated, 4h)
| render timechart
Again, we see the breakdown in our visual.
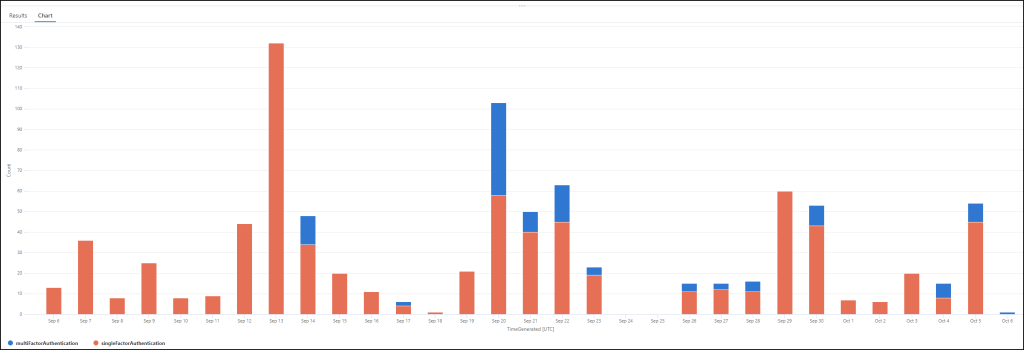
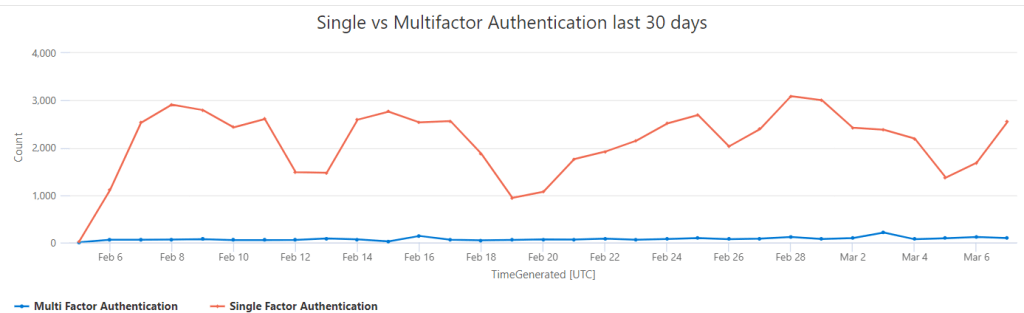
We can still use bar charts with time-series data as well. This can be a really great way to show changes or anomalies in your data. Take for instance our single factor vs multifactor query again. This time though we will group the data into 1-day bins. Then render them as a column chart.
SigninLogs
| where TimeGenerated > ago(30d)
| where ResultType == 0
| summarize Count=count() by AuthenticationRequirement, bin(TimeGenerated, 1d)
| render columnchart
The default behaviour with column charts is for KQL to ‘stack’ the columns into a single column per time period (1-day in this example). We can tell KQL to unstack them though so that we get a column for each result, on every day.
SigninLogs
| where TimeGenerated > ago(30d)
| where ResultType == 0
| summarize Count=count() by AuthenticationRequirement, bin(TimeGenerated, 1d)
| render columnchart with (kind=unstacked)
We see the same data, just presented differently. Unstacked column charts can have a really great visual impact.
Summarize vs make-series
For time queries, KQL has a second, similar operator called make-series. When we use summarize and there are no results in that particular time period, then there is simply no record for that particular time ‘bin’. This can have the effect of your visuals tending to be a little ‘smoother’ over periods where you did have results. If you use make-series, we can tell KQL to default to 0 when there are no hits, making the visual more ‘accurate’. Take for example our regular successful Azure AD signs. Our summarize query and visual looks like this.
SigninLogs
| where TimeGenerated > ago(30d)
| where ResultType == 0
| summarize Count=count() by bin(TimeGenerated, 4h)
| render timechart
This is the equivalent query with make-series. We tell KQL to default to 0 and to use a time increment (or step) of 4 hours.
SigninLogs
| where TimeGenerated > ago(30d)
| where ResultType == 0
| make-series Count=count() default=0 on TimeGenerated step 4h
| render timechart
And our resulting visual.
You can see the difference in those times where there was no sign ins. From September 24th to 26th the line is at zero on the make-series version. On the summarize version it moves between the two points where there were results.
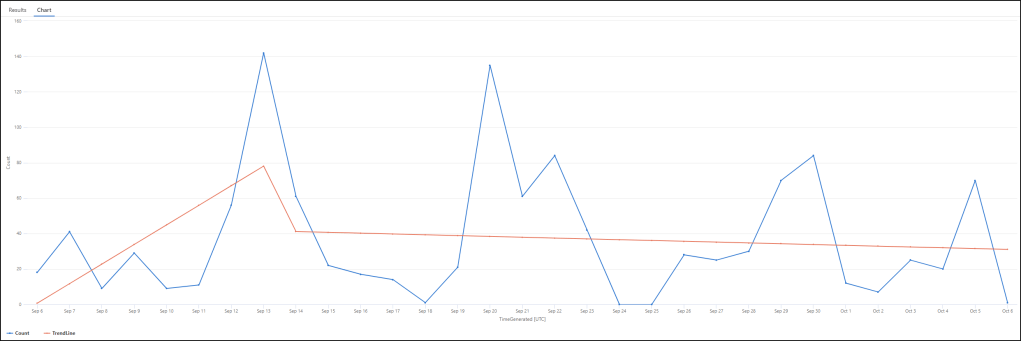
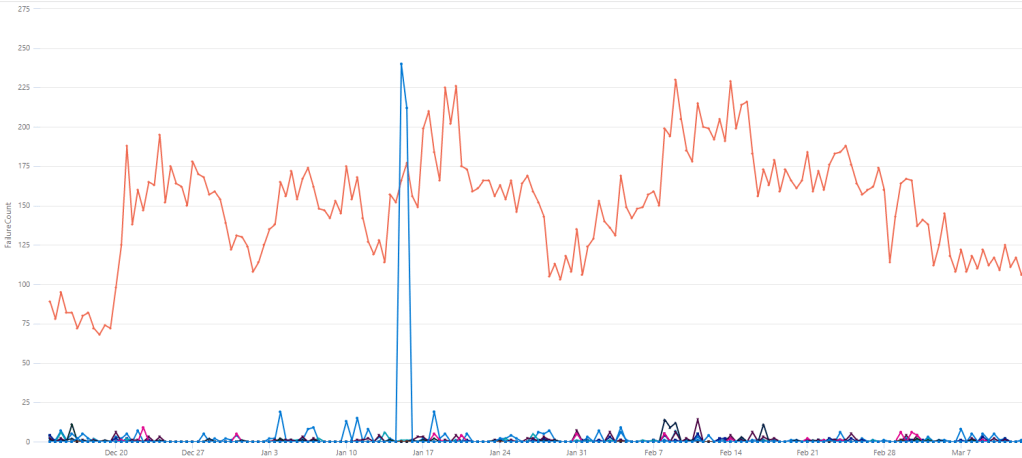
Make-series has some additional capability, allowing true time-series analysis. For example, you can overlay a trend line over your series. For example. looking at conditional access failures to our tenant may be interesting. We can search for error code 53003 and then overlay a trend to our visual.
Now we can see our orange trend as well as the actual count. Trend information may be interesting for things like MFA and passwordless usage or tracking usage of a particular application. Simply write your query first like normal, then apply the trend line over the top.
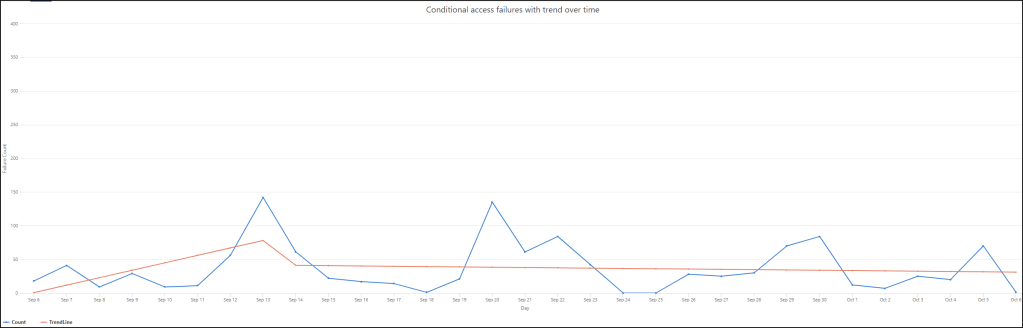
Cleaning up your visuals
To make your visuals really shine you can even tidy up things like axis names and titles within your query. Using our last example, we can add new axis titles and a title to the whole visual. We call our y-axis “Failure Count”, the x-axis “Day” and the whole visual “Conditional access failures with trend over time”.
SigninLogs
| where TimeGenerated > ago(30d)
| where ResultType != "53003"
| make-series Count=count() default=0 on TimeGenerated step 1d
| extend (RSquare, SplitIdx, Variance, RVariance, TrendLine)=series_fit_2lines(Count)
| project TimeGenerated, Count, TrendLine
| render timechart with (xtitle="Day", ytitle="Failure Count", title="Conditional access failures with trend over time")
You can also adjust the y-axis scale. For example, if you ran our previous query and saw the results. You may have thought ‘these are pretty low, but if someone was to look at this visual, they will see the peaks and worry’. Even though the peaks themselves are relatively low. To counter that you can extend the y-axis, by setting a manual max limit. For instance, let’s set it to 400.
SigninLogs
| where TimeGenerated > ago(30d)
| where ResultType != "53003"
| make-series Count=count() default=0 on TimeGenerated step 1d
| extend (RSquare, SplitIdx, Variance, RVariance, TrendLine)=series_fit_2lines(Count)
| project TimeGenerated, Count, TrendLine
| render timechart with (xtitle="Day", ytitle="Failure Count", title="Conditional access failures with trend over time",ymax=400)
We can see that our scale changes and maybe it better tells our story.
Within your environment there are so many great datasets to draw inspiration from to visualize. You can use them to search for anomalies from a threat hunting point of view. They can also be good for showing progress in projects. If you’re enabling MFA then check your logs and visualize how that journey is going.
Have a read of the guidance for the render operator. There are additional visualization options available. Also just be aware of the capability differences between both the platform – Azure Data Explorer vs Azure Monitor, and the agent you are using. The full Kusto agent has additional capabilities over the web apps.
One of my favourite sayings is ‘don’t let perfect be the enemy of good’. I think in cyber security, we can all be guilty of striving for perfection. Whether that is your MFA deployment, reducing local admin privilege or whatever your project may be. The reality is, in most larger organizations you will always have exclusions to your policies. There are likely people which require a different set of rules to be applied to them. They key however is to keep making progress while trying to find solutions.
Similarly, if organizational red tape is preventing security policies being rolled out, then initially deploy to those users and systems that won’t be impacted in anyway. I also really love the saying ‘analysis paralysis’ to refer to this in organizations. Organizations can be caught up trying to overengineer solutions that solve every potential fringe use case that they end up making no progress.
Perhaps you have some edge use cases where MFA is difficult to deploy – maybe you have users work in environments where mobile phone usage is banned. That shouldn’t prevent you from deploying MFA to the vast majority of users who do have access to their phone. That isn’t to say you forget about those users, it just doesn’t become a showstopper for any MFA deployment.
If you use Microsoft Sentinel or Advanced Hunting you probably view them as detection platforms, which they definitely are. However, they also provide us with a rich set of data which we can use as a baseline to build and target security policies. Using KQL and the data in these platforms, we can quickly see the impact of our planned policies. We can also use the same data to find especially high-risk accounts, devices or applications to prioritize.
Azure AD Identities
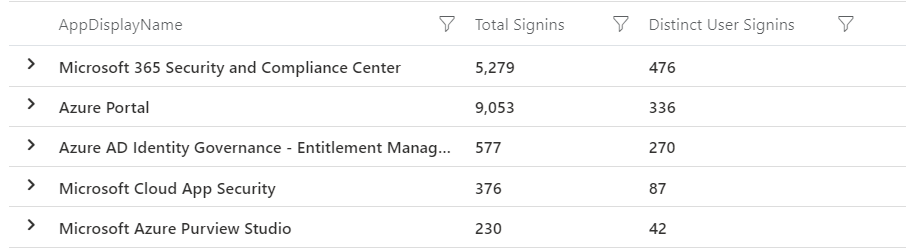
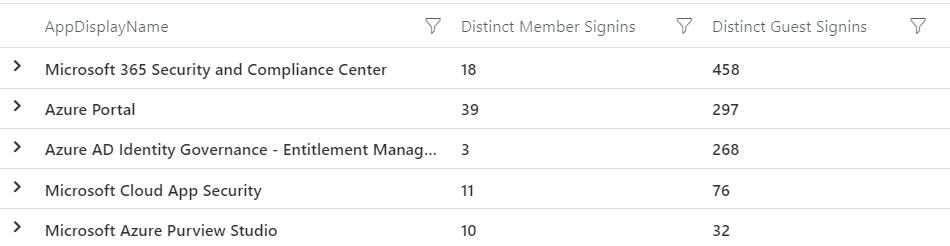
I am sure everyone would love to have MFA everywhere, all the time. The reality is most organizations are still working toward that. As you progress, you may want to target high risk applications. Applications such as control plane management for Azure or Defender services or VPN and remote access portals. Applications with a lot of personal or financial data are always attractive targets for threat actors too. We can use KQL to calculate the percentage of authentications to each application that are covered by MFA.
You can then filter that list on particular apps you consider risky, or look for the apps with the worst coverage and start there.
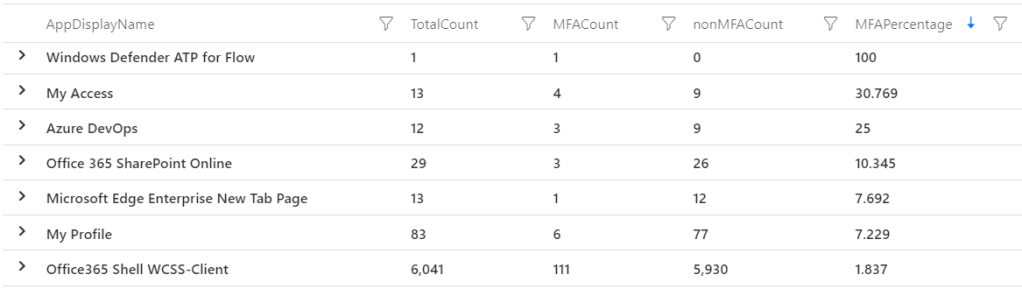
You could alternatively look at it from an identity point of view. Maybe your broader MFA rollout will take a while, but you could enforce MFA across your privileged users straight away. You then get an immediate security benefit by enforcing those controls on your highest risk users. This query finds the MFA percentage for any users with an Azure AD role or ‘admin’ in their username.
//Microsoft Sentinel query
let privusers=
    IdentityInfo
    | where TimeGenerated > ago(21d)
    | summarize arg_max(TimeGenerated, *) by AccountUPN
    | where isnotempty(AssignedRoles)
//Look for users who hold a privileged role or who have admin in their title, you may need to update to your naming standards
    | where AssignedRoles != "[]" or AccountUPN contains "admin"
    | distinct AccountUPN;
SigninLogs
| where TimeGenerated > ago(30d)
| where ResultType == 0
| where UserPrincipalName in~ (privusers)
| summarize
    ['Total Signin Count']=count(),
    ['Total MFA Count']=countif(AuthenticationRequirement == "multiFactorAuthentication"),
    ['Total non MFA Count']=countif(AuthenticationRequirement == "singleFactorAuthentication")
    by UserPrincipalName
| project
    UserPrincipalName,
    ['Total Signin Count'],
    ['Total MFA Count'],
    ['Total non MFA Count'],
   MFAPercentage=(todouble(['Total MFA Count']) * 100 / todouble(['Total Signin Count']))
| sort by MFAPercentage asc
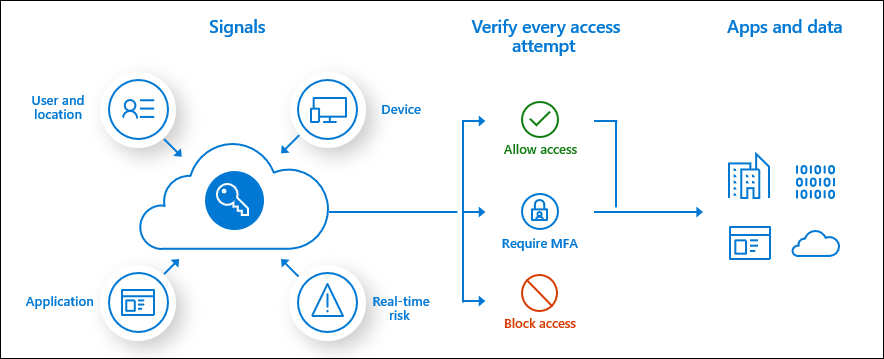
Another improvement you can make to your identity security is to migrate from weaker MFA methods to stronger ones. This diagram from the Microsoft docs is a great example of this. We know that any MFA is better than no MFA, but we also know that apps like the Authenticator app or going passwordless is even better.
With Microsoft Sentinel if we query our Azure AD sign in data, we can find which users are only using text message. The fact is those users are already doing some kind of MFA, so perhaps some targeted training for those users to get them to move up to a better method. The Authenticator app or passwordless technologies have always been a really easy sell for me. In cyber security we don’t always have solutions that are both more secure and a better user experience. So, when we do run across them, like passwordless, we should embrace them. The following query (available only in Sentinel) will find those users who have only used text message as their MFA method.
//Microsoft Sentinel query
SigninLogs
| where TimeGenerated > ago(30d)
//You can exclude guests if you want, they may be harder to move to more secure methods, comment out the below line to include all users
| where UserType == "Member"
| mv-expand todynamic(AuthenticationDetails)
| extend ['Authentication Method'] = tostring(AuthenticationDetails.authenticationMethod)
| where ['Authentication Method'] !in ("Previously satisfied", "Password", "Other")
| where isnotempty(['Authentication Method'])
| summarize
    ['Count of distinct MFA Methods']=dcount(['Authentication Method']),
    ['List of MFA Methods']=make_set(['Authentication Method'])
    by UserPrincipalName
//Find users with only one method found and it is text message
| where ['Count of distinct MFA Methods'] == 1 and ['List of MFA Methods'] has "text"
Another win you can get in Azure AD is to find users who are trying to use the self-service password reset functionality but failing. The logging for SSPR is really verbose so we get great insights from the data. For instance, we can find users who are attempting to reset their password but don’t have a phone number registered. This is a good chance to reach out to those users and get them enrolled fully – the new combined registration lets them get enrolled into MFA at the same time. Guide them through onboarding the Authenticator app over text message!
AuditLogs
| where LoggedByService == "Self-service Password Management"
| extend User = tostring(parse_json(tostring(InitiatedBy.user)).userPrincipalName)
| extend ['User IP Address'] = tostring(parse_json(tostring(InitiatedBy.user)).ipAddress)
| sort by TimeGenerated asc
| summarize ['SSPR Actions']=make_list(ResultReason) by CorrelationId, User, ['User IP Address']
| where ['SSPR Actions'] has "User's account has insufficient authentication methods defined. Add authentication info to resolve this"
| sort by User desc
Another SSPR query that is helpful; you can find users who are getting stuck during the password reset flow. There is nothing more annoying for a user that is trying to do the right thing but getting stuck. This query will find users who are attempting to reset their password but failing multiple times – possibly due to password complexity requirements. If you are making progress to deploying passwordless technologies, these users may be a good fit.
AuditLogs
| where LoggedByService == "Self-service Password Management"
| extend User = tostring(parse_json(tostring(InitiatedBy.user)).userPrincipalName)
| extend ['User IP Address'] = tostring(parse_json(tostring(InitiatedBy.user)).ipAddress)
| sort by TimeGenerated asc
| summarize ['SSPR Actions']=make_list_if(ResultReason, ResultReason has "User submitted a new password") by CorrelationId, User, ['User IP Address']
| where array_length(['SSPR Actions']) >= 3
| sort by User desc
It wouldn’t be a post about Azure AD without a legacy authentication query. Microsoft is beginning to disable legacy auth in Exchange Online (starting October 1). However, you should still block legacy auth in Conditional Access, because it is used in other places other than Exchange. The easiest place to start is simply build a Conditional Access policy and block it for those users that have never used legacy auth. If they aren’t using it already, then don’t let them (or an attacker) start using it. You could achieve this a number of ways, but in my opinion the easiest is just to create a list of all your identities. From that, we can find those that have not used legacy auth in the last 30 days.
//Microsoft Sentinel query
let legacyauthusers=
SigninLogs
| where TimeGenerated > ago(30d)
| where ResultType == 0
| where ClientAppUsed !in ("Mobile Apps and Desktop clients", "Browser")
| distinct UserPrincipalName;
IdentityInfo
| where TimeGenerated > ago(30d)
| summarize arg_max(TimeGenerated, *) by AccountCloudSID
| where UserType == "Member"
| distinct AccountUPN
| where isnotempty(AccountUPN)
| where AccountUPN !in~ (legacyauthusers)
//Advanced Hunting query
let legacyauthusers=
AADSignInEventsBeta
| where ErrorCode == 0
| where ClientAppUsed !in ("Mobile Apps and Desktop clients", "Browser")
| distinct AccountUpn;
IdentityInfo
| distinct AccountUpn
| where isnotempty( AccountUpn)
| where AccountUpn !in (legacyauthusers)
Azure AD Conditional Access for workload identities allows us to control which IP addresses our Azure AD service principals connect from. Depending on the nature of your service principals, they may change IP addresses a lot, or they may be quite static. We can use both Advanced Hunting and Microsoft Sentinel to find a list of service principals that are only connecting from a single IP address. You can then use this data to build out Conditional Access policies. If one of those service principals is then compromised and a threat actor connects from elsewhere, they will be blocked. The data for this query is held in the AADSpnSignInEventsBeta in Advanced Hunting (requires Azure AD P2) or AADServicePrincipalSignInLogs in Microsoft Sentinel (assuming you have the data ingesting).
//Microsoft Sentinel query
let appid=
    AADServicePrincipalSignInLogs
    | where TimeGenerated > ago (30d)
    | where ResultType == 0
    | summarize dcount(IPAddress) by AppId
    | where dcount_IPAddress == 1
    | distinct AppId;
AADServicePrincipalSignInLogs
| where TimeGenerated > ago (30d)
| where ResultType == 0
| where AppId in (appid)
| summarize ['Application Id']=make_set(AppId) by IPAddress, ServicePrincipalName
//Advanced Hunting query
let appid=
    AADSpnSignInEventsBeta
    | where Timestamp > ago (30d)
    | where ErrorCode == 0
    | where IsManagedIdentity == 0
    | summarize dcount(IPAddress) by ApplicationId
    | where dcount_IPAddress == 1
    | distinct ApplicationId;
AADSpnSignInEventsBeta
| where Timestamp > ago (30d)
| where ErrorCode == 0
| where ApplicationId in (appid)
| summarize ['Application Id']=make_set(ApplicationId) by IPAddress, ServicePrincipalName
Local Admin Access & Lateral Movement
When attackers compromise a workstation, the user they initially breach my not have a lot of privilege. A threat actor will try to move laterally and escalate privilege from that initial foothold. We can try to reduce privilege credentials being left on devices by using tools like LAPS and not using domain admin level accounts when accessing end user workstations. Unless you have some kind of privileged access management software that enforces these behaviors though, chances are privileged credentials are being left on a number of devices. We can use Defender and Sentinel data to try and target the most vulnerable devices and users.
For instance, this query will summarize logons to your devices where the user has local admin rights. From that list we sort our devices by those that have the most unique accounts signing in with local admin privilege. If an attacker was to compromise one of these, then there is a chance they can get access to the credentials for all the users who have logged on using mimikatz or something similar.
//Microsoft Sentinel query
DeviceLogonEvents
| where TimeGenerated > ago(30d)
| project DeviceName, ActionType, LogonType, AdditionalFields, InitiatingProcessCommandLine, AccountName, IsLocalAdmin
| where ActionType == "LogonSuccess"
| where LogonType in ("Interactive","RemoteInteractive")
| where AdditionalFields.IsLocalLogon == true
| where InitiatingProcessCommandLine == "lsass.exe"
| summarize
    ['Local Admin Distinct User Count']=dcountif(AccountName,IsLocalAdmin == "true"),
    ['Local Admin User List']=make_set_if(AccountName, IsLocalAdmin == "true")
    by DeviceName
| sort by ['Local Admin Distinct User Count']
//Advanced Hunting query
DeviceLogonEvents
| where Timestamp > ago(30d)
| project DeviceName, ActionType, LogonType, AdditionalFields, InitiatingProcessCommandLine, AccountName, IsLocalAdmin
| where ActionType == "LogonSuccess"
| where LogonType in ("Interactive","RemoteInteractive")
| where IsLocalAdmin == true
| where InitiatingProcessCommandLine == "lsass.exe"
| summarize
    ['Local Admin Distinct User Count']=dcountif(AccountName,IsLocalAdmin == "true"),
    ['Local Admin User List']=make_set_if(AccountName, IsLocalAdmin == "true")
    by DeviceName
| sort by ['Local Admin Distinct User Count'] desc
If we run the same query again, we can reverse our summary. This time we find the accounts which have logged onto the most devices as local admin. This will show us our accounts with the largest blast radius. If one of these accounts is compromised, then the attacker would also have local admin access to all the devices listed.
//Microsoft Sentinel query
DeviceLogonEvents
| where TimeGenerated > ago(30d)
| project DeviceName, ActionType, LogonType, AdditionalFields, InitiatingProcessCommandLine, AccountName, IsLocalAdmin
| where ActionType == "LogonSuccess"
| where LogonType in ("Interactive","RemoteInteractive")
| where AdditionalFields.IsLocalLogon == true
| where InitiatingProcessCommandLine == "lsass.exe"
| summarize
    ['Local Admin Distinct Device Count']=dcountif(DeviceName,IsLocalAdmin == "true"),
    ['Local Admin Device List']=make_set_if(DeviceName, IsLocalAdmin == "true")
    by AccountName
| sort by ['Local Admin Distinct Device Count'] desc
//Advanced Hunting query
DeviceLogonEvents
| where Timestamp > ago(30d)
| project DeviceName, ActionType, LogonType, AdditionalFields, InitiatingProcessCommandLine, AccountName, IsLocalAdmin
| where ActionType == "LogonSuccess"
| where LogonType in ("Interactive","RemoteInteractive")
| where IsLocalAdmin == true
| where InitiatingProcessCommandLine == "lsass.exe"
| summarize
    ['Local Admin Distinct Device Count']=dcountif(DeviceName,IsLocalAdmin == "true"),
    ['Local Admin Device List']=make_set_if(DeviceName, IsLocalAdmin == "true")
    by AccountName
| sort by ['Local Admin Distinct Device Count'] desc
You can use this same data to hunt for service accounts that are logging into devices. In a perfect world that doesn’t happen of course, but the reality is some software vendors make products where it is required. You may find that IT admins are being lazy and just using those service accounts everywhere though. They often won’t have controls like MFA and possibly have a worse password. For an attacker, service accounts are gold, since the monitoring around them is often weak.
//Microsoft Sentinel query
DeviceLogonEvents
| where TimeGenerated > ago(30d)
| project DeviceName, ActionType, LogonType, AdditionalFields, InitiatingProcessCommandLine, AccountName, IsLocalAdmin
| where ActionType == "LogonSuccess"
| where LogonType in ("Interactive","RemoteInteractive")
| where AdditionalFields.IsLocalLogon == true
| where InitiatingProcessCommandLine == "lsass.exe"
//Search only for accounts starting with svc or containing service. You may need to substitute in your service account naming standard.
| where AccountName startswith "svc" or AccountName contains "service"
| summarize
    ['Local Admin Distinct Device Count']=dcountif(DeviceName,IsLocalAdmin == "true"),
    ['Local Admin Device List']=make_set_if(DeviceName, IsLocalAdmin == "true")
    by AccountName
| sort by ['Local Admin Distinct Device Count'] desc
Once you have your list, you can then start to enforce what machines they can access. If svc.sqlapp only needs to logon to 2 machines, then just configure that in Active Directory. You can then alert on activity outside of that which may be malicious.
If you don’t use Defender for Endpoint you can use the Windows security event log to achieve a similar summary. For instance, you can find the devices with the most users connecting via RDP. Then you can reverse that query and find the users connecting to the most devices. Just like our Defender data.
//Microsoft Sentinel query
SecurityEvent
| where TimeGenerated > ago(30d)
| where EventID == "4624"
| where LogonType == 10
//Extend new column that drops Account to lower case so users are correctly summarized, i.e User123 and user123 are combined
| extend AccountName=tolower(Account)
| summarize
    ['Count of Users']=dcount(AccountName),
    ['List of Users']=make_set(AccountName)
    by Computer
| sort by ['Count of Users'] desc
//Microsoft Sentinel query
SecurityEvent
| where TimeGenerated > ago(30d)
| where EventID == "4624"
| where LogonType == 10
//Extend new column that drops Account to lower case so users are correctly summarized, i.e User123 and user123 are combined
| extend AccountName=tolower(Account)
| summarize
    ['Count of Computers']=dcount(Computer),
    ['List of Computers']=make_set(Computer)
    by AccountName
| sort by ['Count of Computers'] desc
Attack surface reduction rules
Attack surface reduction (ASR) rules are a really great feature of Defender that help protect your device against certain behaviours. Instead of targeting particular malicious files (which Defender still does of course), they instead block against behaviour. For instance, ASR may block a file that when executed attempts to connect to the internet and download further files. IT and cyber security departments are often wary of these rules impacting users negatively. There are still lots of ways to get some quick wins with ASR, without stopping users from being able to work. If you are evaluating ASR then you should absolutely put the rules into audit mode. This will write an event to Advanced Hunting and Sentinel each time a rule would have blocked a file or program if block mode was enabled. Once you have done that, you have a great set of data to start making progress.
The following query will find machines that have triggered no ASR rules over the last 30 days. These machines would be a good starting point to enable ASR in block mode. You have the data showing they haven’t triggered any rules in the last 30 days.
//Microsoft Sentinel query
//First find devices that have triggered an Attack Surface Reduction rule, either block or in audit mode.
let asrdevices=
    DeviceEvents
    | where TimeGenerated > ago (30d)
    | where ActionType startswith "Asr"
    | distinct DeviceName;
//Find all devices and exclude those that have previously triggered a rule
DeviceInfo
| where TimeGenerated > ago (30d)
| where OSPlatform startswith "Windows"
| summarize arg_max(TimeGenerated, *) by DeviceName
| where DeviceName !in (asrdevices)
| project
    ['Time Last Seen']=TimeGenerated,
    DeviceId,
    DeviceName,
    OSPlatform,
    OSVersion,
    LoggedOnUsers
//First find devices that have triggered an Attack Surface Reduction rule, either block or in audit mode.
let asrdevices=
    DeviceEvents
    | where Timestamp > ago (30d)
    | where ActionType startswith "Asr"
    | distinct DeviceName;
//Find all devices and exclude those that have previously triggered a rule
DeviceInfo
| where Timestamp > ago (30d)
| where OSPlatform startswith "Windows"
| summarize arg_max(Timestamp, *) by DeviceName
| where DeviceName  !in (asrdevices)
| project
    ['Time Last Seen']=Timestamp,
    DeviceId,
    DeviceName,
    OSPlatform,
    OSVersion,
    LoggedOnUsers
You can also summarize your ASR audit data. The following query will list the total count, distinct device count and the list of devices for each rule that is being triggered.
//Microsoft Sentinel query
DeviceEvents
| where TimeGenerated > ago(30d)
| where ActionType startswith "Asr"
| where isnotempty(InitiatingProcessCommandLine)
| summarize ['ASR Hit Count']=count(), ['Device Count']=dcount(DeviceName), ['Device List']=make_set(DeviceName) by ActionType, InitiatingProcessCommandLine
| sort by ['ASR Hit Count'] desc
//Advanced Hunting query
DeviceEvents
| where Timestamp > ago(30d)
| where ActionType startswith "Asr"
| where isnotempty(InitiatingProcessCommandLine)
| summarize ['ASR Hit Count']=count(), ['Device Count']=dcount(DeviceName), ['Device List']=make_set(DeviceName) by ActionType, InitiatingProcessCommandLine
| sort by ['ASR Hit Count'] desc
It also lists the process command line that flagged the rule. From that list you can see if you have any common software or processes across your devices triggering ASR hits. If you have a particular vendor piece of software that is flagging ASR rules across all your devices, you can reach out to the vendor for an update. Alternatively, you could look at excluding that particular rule and process combination. In the perfect world, we would have no exclusions to AV or EDR, but if you are dealing with legacy software or other tech debt that may not be realistic. I would personally rather have ASR enabled with a small exclusion list, than not have it on at all. With KQL you can help build those rules out with minimal disruption to your users.
These are just a few examples of analyzing the data you have to try and improve your security hygiene. Remember, you don’t need to perfect, there is no such thing as 100% secure. Attacks are constantly evolving. Use the tools and data you have today to make meaningful progress to reducing risk.
If you follow my Twitter or GitHub account, you know that I recently completed a #365daysofKQL challenge. Where I shared a hunting query each day for a year. To round out that challenge, I wanted to share what I have learnt over the year. Like any activity, the more you practice, the better you become at it. At about day 200, I went back to a lot of queries and re-wrote them with things I had picked up. I wanted to make my queries easier to read and more efficient. Some people also asked if I was ever short of ideas. I never had writers block or struggled to come up with ideas. I am a naturally curious person, so looking through data sets is interesting to me. On top of that there is always a new threat, or a new vulnerability around. Threat actors come up with new tactics and you can then try and find those. Then you can take those queries and apply them to other data sets. On top of that, vendors, especially Microsoft are always adding new data in. There is always something new to look at.
I have also learned that KQL is a very repeatable language. You can build ‘styles’ of queries, and then re-use those on different logs. If you are looking for the first time something happened. Or if something happened at a weird time of the day. That becomes a query pattern. Sure, the content of the data you are looking at may change. The structure of the query remains the same.
So without further ado, what I have learnt writing 365 queries.
Use your own account and privilege to generate alerts
If you follow InfoSec news, there is always a new activity you may want to alert on. As these new threats are uncovered, hopefully you don’t find them in your environment. But you want to be ready. I find it valuable to look at the details and attempt to create those logs and then go find them. From there you can tidy your query up so it is accurate. You don’t want to run malicious code or do anything that will cause an outage. You can certainly simulate the adversary though. Take for instance consent phishing. You don’t want to actually install a malicious app. You can register an app manually though. You could then query your Azure AD audit logs to find that event. Start really broadly with just seeing what you have done with your account.
AuditLogs
| where InitiatedBy contains "youruseraccount"
You will see an event ‘Add service principal’, that is what we are after. In the Azure AD audit log, this is a ‘OperationaName’. So we can then tune our query. We know we want any ‘Add service principal’ events. We can also look through and see where our username is and our IP. So we can extend those to new columns. For our actual query we don’t want to include our user account, so take that out.
AuditLogs
| where OperationName == "Add service principal"
| extend Actor = tostring(parse_json(tostring(InitiatedBy.user)).userPrincipalName)
| extend IPAddress = tostring(parse_json(tostring(InitiatedBy.user)).ipAddress)
| project TimeGenerated, OperationName, Actor, IPAddress
Now we have a query that detects each time someone adds a service principal. If someone is consent phished, this will tell us. Then we can investigate. We can then delete our test service principal out to clean up our tenant.
Look for low volume events
One of the best ways to find interesting events, is to find those that are low volume. While not always malicious they are generally worth investigating. Using our Azure AD audit log example, it is simple to find low volume events.
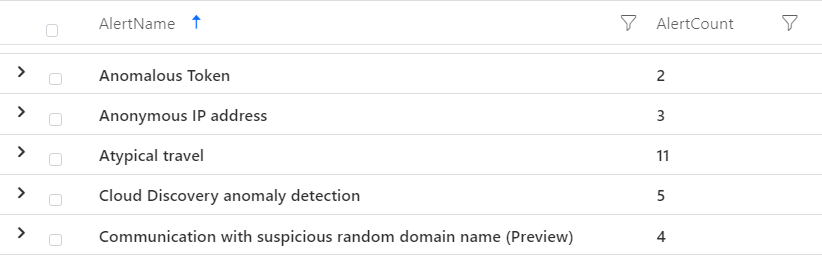
AuditLogs
| summarize Count=count() by OperationName, LoggedByService
| sort by Count asc
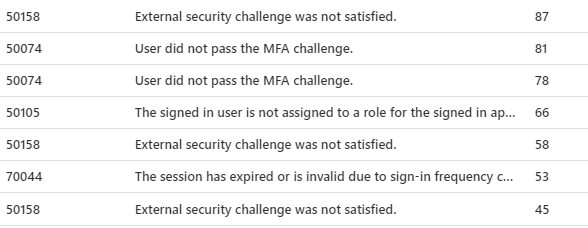
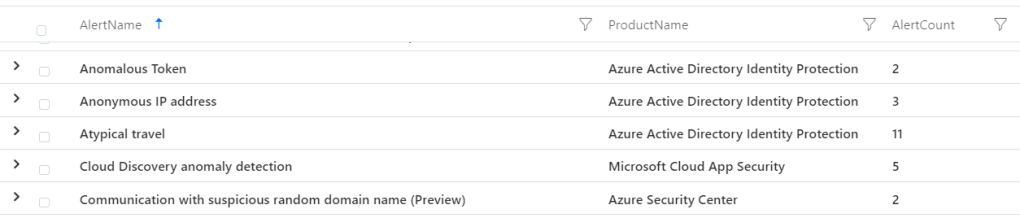
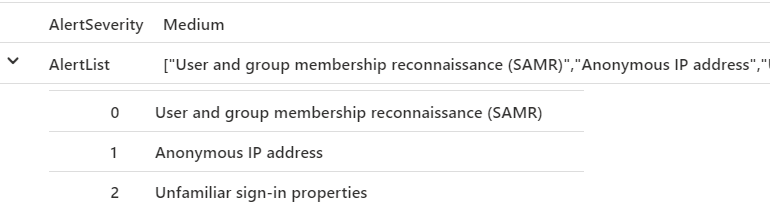
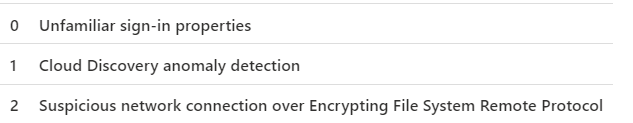
This will return the count of all the operations in Azure AD for you, and list those with the fewest hits first. It will also return which service in Azure AD triggered it. Your data will look different to mine, but as an example you may see.
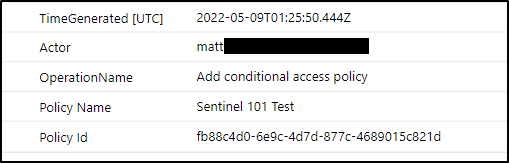
Now you look at this list and you can see if any interest you. Maybe you want to know each time an Azure AD Conditional Policy is updated. We can see that event. Or when a BitLocker key is read. You can then take those operations and start building your queries out.
You can do the same on other data sources, like Office 365.
OfficeActivity
| summarize Count=count() by Operation, OfficeWorkload
| sort by Count asc
The data is a little different, we have Operation instead of OperationName. And we have OfficeWorkload instead of LoggedByService. But the pattern is the same. This time we are returned low count events from the Office 365 audit log.
Look for the first time something occurs and new events
This is a pattern I love using. We can look at new events in our environment that we haven’t previously seen. Like me, I am sure you struggle with new alerts, or new log sources to your environment. Let KQL do it for you. These queries are simple and easily re-useable. Again, let’s use our Azure AD audit log as an example.
let existingoperations=
    AuditLogs
    | where TimeGenerated > ago(180d) and TimeGenerated < ago(7d)
    | distinct OperationName;
AuditLogs
| where TimeGenerated > ago(7d)
| summarize Count=count() by OperationName, Category
| where OperationName !in (existingoperations)
| sort by Count desc
First we cast a variable called ‘existingoperations’. That queries our audit log for events between 180 and 7 days ago. From that list, we just list each distinct OperationName. That becomes our list of events that have already occurred.
We then re-query the audit log again, this time just looking at the last week. We take a count of all the operations. Then we exclude the ones we already knew about from our first query. Anything remaining is new to our environment. Have a look through the list and see if anything is interesting to you. If it is, then you can write your specific query.
Look for when things stop occurring
The opposite to new events occurring is when events stop occurring. One of the most common use cases for this kind of query is tell me when a device is no longer sending logs. To keep on top of detections we need to make sure devices are still sending their logs.
SecurityEvent
| where TimeGenerated > ago (1d)
| summarize ['Last Record Received']  = datetime_diff("minute", now(), max(TimeGenerated)) by Computer
| project Computer, ['Last Record Received']
| where ['Last Record Received'] >= 60
| order by ['Last Record Received'] desc
This query will find any device that hasn’t send a security event log in over 60 minutes in the last day. Maybe the machine is offline, or there are network issues? Worth checking out either way.
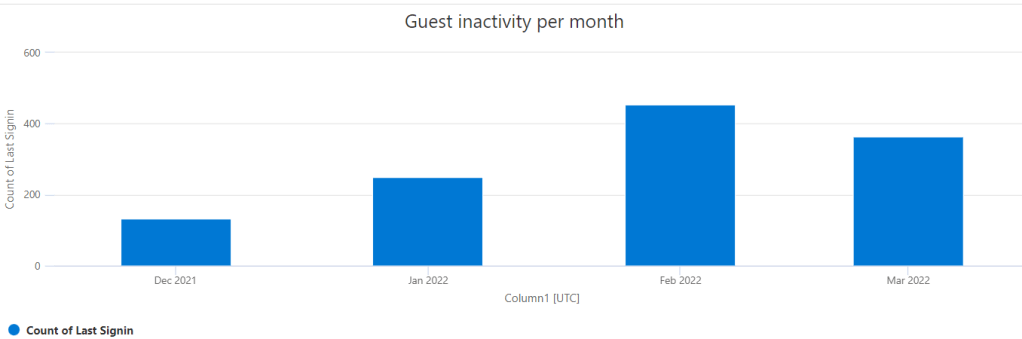
We can use that same concept to find all kinds of things. How about user accounts no longer signing in? That is also something that is no longer occurring. This time though, it isn’t really an ‘alert’. It is great way to clean up user accounts though.
SigninLogs
| where TimeGenerated > ago (365d)
| where ResultType == 0
| where isnotempty(UserType)
| summarize arg_max(TimeGenerated, *) by UserPrincipalName
| where TimeGenerated < ago(60d)
| summarize
    ['Inactive Account List']=make_set(UserPrincipalName),
    ['Count of Inactive Accounts']=dcount(UserPrincipalName)
    by UserType, Month=startofmonth(TimeGenerated)
| sort by Month desc, UserType asc
We can find all our user accounts, both members and guests, that haven’t signed in for more than 60 days. We can also retrieve the last month they last accessed our tenant.
Look for when things occur at strange times
KQL is amazing at dealing with time data. We can include any kind of logic into our queries to detect only during certain times. Or on certain days. Or a combination of both. An event that happens over a weekend of outside of working hours perhaps requires a faster response. A couple of good examples this are Azure AD Privileged Identity Management and adding a service principal to Azure AD. Maybe Monday to Friday, during business hours these activities are pretty normal. Outside of that though? We can tell KQL to focus on those times.
let Saturday = time(6.00:00:00);
let Sunday = time(0.00:00:00);
AuditLogs
// extend LocalTime to your time zone
| extend LocalTime=TimeGenerated + 5h
| where LocalTime > ago(7d)
// Change hours of the day to suit your company, i.e this would find activations between 6pm and 6am
| where hourofday(LocalTime) !between (6 .. 18) or hourofday(LocalTime)
| where OperationName == "Add member to role completed (PIM activation)"
| extend User = tostring(parse_json(tostring(InitiatedBy.user)).userPrincipalName)
| extend ['Azure AD Role Name'] = tostring(TargetResources[0].displayName)
| project LocalTime, User, ['Azure AD Role Name'], ['Activation Reason']=ResultReason
This query searches for PIM activations on weekends or between 6pm and 6am during the week. You can then re-use that same logic to detect on other things during those times.
Summarize to make sense of large data sets
I have written about data summation previously. If you send data to Sentinel chances are you will have a lot of it. Even a small Azure AD tenant generates a lot of data. 150 devices in Defender is a lot of logs. Summarizing data in KQL is both easy and useful. Maybe you are interested in what your users are doing when they connect to other tenants. Each log entry on its own probably isn’t exciting. If you allow that activity then it isn’t really a detection. You wouldn’t generate an alert each time someone accessed another tenant. You may be interested in other tenants more broadly though.
SigninLogs
| where TimeGenerated > ago(30d)
| where UserType == "Guest"
| where AADTenantId == HomeTenantId
| where ResourceTenantId != AADTenantId
| summarize
    ['Count of Applications']=dcount(AppDisplayName),
    ['List of Applications']=make_set(AppDisplayName),
    ['Count of Users']=dcount(UserPrincipalName),
    ['List of Users']=make_set(UserPrincipalName)
    by ResourceTenantId
| sort by ['Count of Users'] desc
This query looks for each ResourceTenantId. Which is the Id of the tenant your users are accessing. For each tenant, it returns what applications, a count of applications, which users and a count of users accessing it. Maybe you see in that data there is one tenant that your users are accessing way more than any other. It may be worth investigating why or adding additional controls to that tenant via cross-tenant settings.
Another good example, we can use Defender for Endpoint logs for all kinds of great info. Take for example LDAP and LDAPS traffic. Hopefully you want to migrate to LDAPS, which is more secure. If you look at each LDAP event to see what’s in your environment, it will be overwhelming. Chances are you will get thousands of results a day.
DeviceNetworkEvents
| where ActionType == "InboundConnectionAccepted"
| where LocalPort in ("389", "636", "3269")
| summarize
    ['Count of Inbound LDAP Connections']=countif(LocalPort == 389),
    ['Count of Distinct Inbound LDAP Connections']=dcountif(RemoteIP, LocalPort == 389),
    ['List of Inbound LDAP Connections']=make_set_if(RemoteIP, LocalPort == 389),
    ['Count of Inbound LDAPS Connections']=countif(LocalPort in ("636", "3269")),
    ['Count of Distinct Inbound LDAPS Connections']=dcountif(RemoteIP, LocalPort in ("636", "3269")),
    ['List of Inbound LDAPS Connections']=make_set_if(RemoteIP, LocalPort in ("636", "3269"))
    by DeviceName
| sort by ['Count of Distinct Inbound LDAP Connections'] desc
This query looks at all those connections, and summarizes it down so it’s easier to read. For each device on our network we summarize those connections. For each we get the total count of connections, a count of distinct endpoints and the list of endpoints. Maybe we have thousands and thousands of events per day. When we run this query though, it is really just a handful of noisy machines. Suddenly that LDAPS migration isn’t so daunting.
Change your data summary to change context
Once you have written your queries that summarize your data, you can then change the context easily. You can basically re-use your work and see something different in the same data. Take these two queries.
DeviceNetworkEvents
| where TimeGenerated > ago(30d)
| where ActionType == "ConnectionSuccess"
| where RemotePort == "3389"
//Exclude Defender for Identity that uses an initial RDP connection to map your network
| where InitiatingProcessCommandLine <> "\"Microsoft.Tri.Sensor.exe\""
| summarize
    ['RDP Outbound Connection Count']=count(),
    ['RDP Distinct Outbound Endpoint Count']=dcount(RemoteIP),
    ['RDP Outbound Endpoints']=make_set(RemoteIP)
    by DeviceName
| sort by ['RDP Distinct Outbound Endpoint Count'] desc
This first query finds which devices in your environment connect to the most other endpoints via RDP. These devices are a target for lateral movement as they have more credentials stored on them.
DeviceLogonEvents
| where TimeGenerated > ago(30d)
| project DeviceName, ActionType, LogonType, AdditionalFields, InitiatingProcessCommandLine, AccountName, IsLocalAdmin
| where ActionType == "LogonSuccess"
| where LogonType == "Interactive"
| where AdditionalFields.IsLocalLogon == true
| where InitiatingProcessCommandLine == "lsass.exe"
| summarize
    ['Local Admin Count']=dcountif(DeviceName,IsLocalAdmin == "true"),
    ['Local Admins']=make_set_if(DeviceName, IsLocalAdmin == "true")
    by AccountName
| sort by ['Local Admin Count'] desc
This second query looks for logon events from your devices. It finds the users that have accessed the most devices as a local admin. Which will find us which accounts are targets for lateral movement.
So two very similar queries. Both provide information about lateral movement targets. However, we change our summary target so we get unique context in the results.
Try to write queries looking for behavior rather than static IOCs
This is another topic I have written about before. We want to, where possible, create queries based on behavior rather than specific IOCs. While IOCs are useful in threat hunting, they are likely to change quickly.
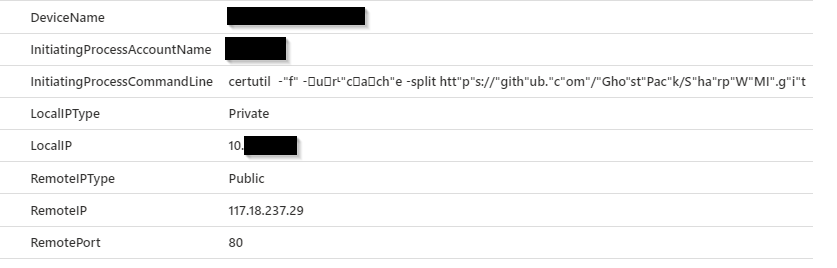
Say for example you read a report about a new threat. It says in there that the threat actor used certutil.exe to connect to 10.10.10.10.
Easy, we will catch if someone uses certutil.exe to connect to 10.10.10.10.
What if the IP changes though? Now the malicious server is on 10.20.20.20. Our query no longer will catch it. So instead go a little broader, and catch the behavior.
The query now detects any usage of certutil.exe connecting to any public endpoint. I would suspect this is very rare behavior in most environments. Now it is irrelevant what the IP is, we will catch it.
Use your data to uplift your security posture
Not every query you write needs to be about threat detection. Of course we want to catch attackers. We can however use the same data to provide amazing insights about security posture. Take for instance Azure Active Directory sign in logs. We can detect when someone signs in from a suspicious country. Just as useful though is all the other data contained in those logs. We can see visibility into conditional access policies, legacy authentication, MFA events, device and location information.
Legacy authentication is always in the news. There is no way to put MFA in front of it, so it is the first door attackers knock on. We can use our sign in data to see just how big a legacy authentication problem we have.
SigninLogs
| where TimeGenerated > ago(30d)
| where ResultType == 0
| where ClientAppUsed !in ("Mobile Apps and Desktop clients", "Browser")
| where isnotempty(ClientAppUsed)
| evaluate pivot(ClientAppUsed, count(), UserPrincipalName)
This query finds any apps that make up legacy authentication. Those that aren’t a modern app or a browser. Then it creates a easy to read pivot table. The table will show each user that has connected with legacy authentication. For each app it will give you a count. Maybe you have 25000 legacy authentication connections in a month, which seems impossible to address. When you look at it closer though, it may just be a few dozen users.
Similarly, you could try to improve your MFA posture.
SigninLogs
| where TimeGenerated > ago(30d)
//You can exclude guests if you want, they may be harder to move to more secure methods, comment out the below line to include all users
| where UserType == "Member"
| mv-expand todynamic(AuthenticationDetails)
| extend ['Authentication Method'] = tostring(AuthenticationDetails.authenticationMethod)
| where ['Authentication Method'] !in ("Previously satisfied", "Password", "Other")
| where isnotempty(['Authentication Method'])
| summarize
    ['Count of distinct MFA Methods']=dcount(['Authentication Method']),
    ['List of MFA Methods']=make_set(['Authentication Method'])
    by UserPrincipalName
//Find users with only one method found and it is text message
| where ['Count of distinct MFA Methods'] == 1 and ['List of MFA Methods'] has "text"
This example looks at each user that has used MFA to your Azure AD tenant. For each, it creates a set of different MFA methods used. For example, maybe they have used a push notification, a phone call and a text. They would have 3 methods in their set of methods. Now we add a final bit of logic. We find out where a user only has a single method, and that method is text. We can take this list and do some education with those users. Maybe show them how much easier a push notification is.
Use your data to help your users have a better experience
If you have onboarded data to Sentinel, or use Advanced Hunting, you can use that data to help your users out. While we aren’t measuring performance of computers or things like that, we can still get insights where they may be struggling.
Take for example Azure AD self service password reset. When a user goes through that workflow they can get stuck in a few spots, and we can find it. Each attempt at SSPR is linked by the same Correlation Id in Azure AD. So we can use that Id to make a list of actions that occurred during that attempt.
AuditLogs
| where LoggedByService == "Self-service Password Management"
| extend User = tostring(parse_json(tostring(InitiatedBy.user)).userPrincipalName)
| extend ['User IP Address'] = tostring(parse_json(tostring(InitiatedBy.user)).ipAddress)
| sort by TimeGenerated asc
| summarize ['SSPR Actions']=make_list(ResultReason) by CorrelationId, User, ['User IP Address']
If you have a look, you will see things like user submitted new password, maybe the password wasn’t strong enough. Hopefully a successful password reset at the end. Now if we want to help our users out we can dig into that data. For instance, we can see when a user tries to SSPR but doesn’t have an authentication method listed. We could reach out to them and help them get onboarded.
AuditLogs
| where LoggedByService == "Self-service Password Management"
| extend User = tostring(parse_json(tostring(InitiatedBy.user)).userPrincipalName)
| extend ['User IP Address'] = tostring(parse_json(tostring(InitiatedBy.user)).ipAddress)
| sort by TimeGenerated asc
| summarize ['SSPR Actions']=make_list(ResultReason) by CorrelationId, User, ['User IP Address']
| where ['SSPR Actions'] has "User's account has insufficient authentication methods defined. Add authentication info to resolve this"
| sort by User desc
If a user puts in a password that doesn’t pass complexity requirements we can see that too. We could query when the same user has tried 3 or more times to come up with a new password and is rejected. We all understand how frustrating that can be. They would definitely appreciate some help and you could maybe even use it as a change to move them to Windows Hello for Business, or passwordless. If you support those, of course.
AuditLogs
| where LoggedByService == "Self-service Password Management"
| extend User = tostring(parse_json(tostring(InitiatedBy.user)).userPrincipalName)
| extend ['User IP Address'] = tostring(parse_json(tostring(InitiatedBy.user)).ipAddress)
| sort by TimeGenerated asc
| summarize ['SSPR Actions']=make_list_if(ResultReason, ResultReason has "User submitted a new password") by CorrelationId, User, ['User IP Address']
| where array_length(['SSPR Actions']) >= 3
| sort by User desc
Consistent data is easy to read data
One of the hardest things about writing a query is just knowing where to look for those logs. The second hardest thing is dealing with data inconsistencies. If you have log data from many vendors, the data will be completely different. Maybe one firewall calls a reject a ‘deny’, another calls it ‘denied’, then your last firewall calls it ‘block’. They are the same in terms of what the firewall did. You have to account for the data differences though. If you don’t, you may miss results.
You can rename tables or even extend your own whenever you want. You can do that to unify your data, or just make it easier to read.
Say you have two pretend firewalls, one is a CheckPoint and one a Cisco. Maybe the CheckPoint shows the result as a column called ‘result’. The Cisco however uses ‘Outcome’.
You can simply rename one of them.
CheckPointLogs_CL
| project-rename Outcome=result
In our CheckPoint logs we have just told KQL to rename the ‘result’ field to ‘Outcome’
You can even do this as part of a ‘project’ at the end of your query if you want.
We have renamed our fake columns to Source IP, Destination IP, Port, Outcome.
If we do the same for our Cisco logs, then our queries will be so much easier to write. Especially if you are joining between different data sets. They will also be much easier to read both for you and anyone else using them.
Be careful of case sensitivity
Remember that a number of string operators are KQL are case sensitive. There is a really useful table here that outlines the different combinations. Using a double equals sign in a query, such as UserPrincipalName == “reprise99@learnsentinel.com” is efficient. Remember though, that if my UserPrincipalName was reprise99@learnSentinel.com with a capital S, it wouldn’t return that result. It is a balancing act between efficiency and accuracy. If you are unsure about the consistency of your data, then stick with case insensitive operators. For example. UserPrincipalName =~ “reprise99@learnsentinel.com” would return results regardless of sensitivity.
This is also true for a not equals operator. != is case sensitive, and !~ is not.
You also have the ability to use either tolower() or toupper() to force a string to be one or the other.
This can help you make your results more consistent.
Use functions to save you time
If you follow my Twitter you know that I write a lot of functions. They are an amazing timesaver in KQL. Say you have written a really great query that tidies data up. Or one that combines a few data sources for you. Save it as function for next time.
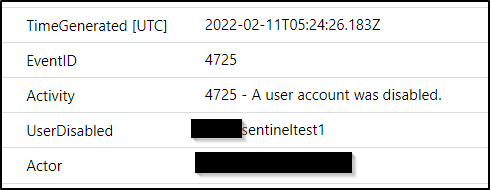
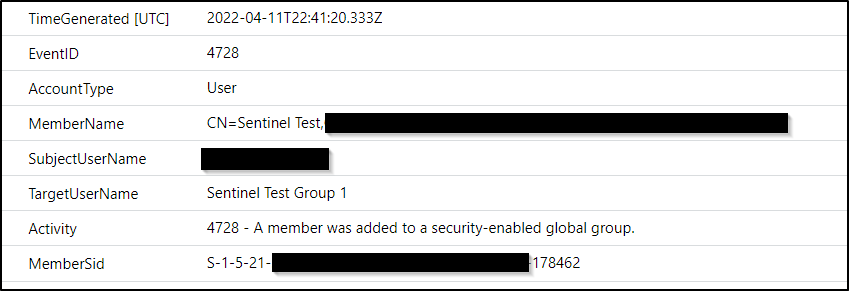
My favourite functions are the ones that unify different data sources that are similar operations. Take adding or removing users to groups in Active Directory and Azure Active Directory. You may be interested in events from both environments. Unfortunately the data structure is completely different. Active Directory events come in via the SecurityEvent table. Whereas, Azure Active Directory events are logged to the AuditLogs table.
This function I wrote combines the two and unifies the data. So you can search for ‘add’ events, and it will bring back when users were added to groups in either environment. When you deploy this function you can easily create queries such as.
GroupChanges
| where GroupName =~ "Sentinel Test Group"
It will find groups named ‘Sentinel Test Group’ in either AD or AAD. It will return you who was added or removed, who did it and which environment the group belongs to. The actual KQL under the hood does all the hard work for you.
let aaduseradded=
    AuditLogs
    | where OperationName == "Add member to group"
    | extend Actor = tostring(parse_json(tostring(InitiatedBy.user)).userPrincipalName)
    | extend Target = tostring(TargetResources[0].userPrincipalName)
    | extend GroupName = tostring(parse_json(tostring(parse_json(tostring(TargetResources[0].modifiedProperties))[1].newValue)))
    | extend GroupID = tostring(parse_json(tostring(parse_json(tostring(TargetResources[0].modifiedProperties))[0].newValue)))
    | where isnotempty(Actor) and isnotempty(Target)
    | extend Environment = strcat("Azure Active Directory")
    | extend Action = strcat("Add")
    | project TimeGenerated, Action, Actor, Target, GroupName, GroupID, Environment;
let aaduserremoved=
    AuditLogs
    | where OperationName == "Remove member from group"
    | extend Actor = tostring(parse_json(tostring(InitiatedBy.user)).userPrincipalName)
    | extend GroupName = tostring(parse_json(tostring(parse_json(tostring(TargetResources[0].modifiedProperties))[1].oldValue)))
    | extend GroupID = tostring(parse_json(tostring(parse_json(tostring(TargetResources[0].modifiedProperties))[0].oldValue)))
    | extend Target = tostring(TargetResources[0].userPrincipalName)
    | where isnotempty(Actor) and isnotempty(Target)
    | extend Action = strcat("Remove")
    | extend Environment = strcat("Azure Active Directory")
    | project TimeGenerated, Action, Actor, Target, GroupName, GroupID, Environment;
let adchanges=
    SecurityEvent
    | project TimeGenerated, EventID, AccountType, MemberName, SubjectUserName, TargetUserName,TargetSid
    | where AccountType == "User"
    | where EventID in (4728, 4729, 4732, 4733, 4756, 4757)
    | parse MemberName with * 'CN=' Target ',OU=' *
    | extend Action = case(EventID in ("4728", "4756", "4732"), strcat("Add"),
        EventID in ("4729", "4757", "4733"), strcat("Remove"), "unknown")
    | extend Environment = strcat("Active Directory")
    | project
        TimeGenerated,
        Action,
        Actor=SubjectUserName,
        Target,
        GroupName=TargetUserName,
        GroupID =TargetSid,
        Environment;
union aaduseradded, aaduserremoved, adchanges
It may look complex, but it isn’t. We are just taking data that isn’t consistent and tidying it up. In AD when we add a user to a group, the group name is actually stored as ‘TargetUserName’ which isn’t very intuitive. So we rename it to GroupName, and we do the same for Azure AD. The Actor and Target are named different in AD and AAD, so let’s just rename them. Then we just add a new column for environment.
KQL isn’t just for Microsoft Sentinel
Not everyone has the budget to use Microsoft Sentinel, and I appreciate that. If you have access to Advanced Hunting you have access to an amazing amount of info there too. Especially if you have an Azure AD P2 license. The following data is available for you, at no additional cost to your existing Defender and Azure AD licensing.
Device events – such as network or logon events.
Email events – emails received or sent, attachment and URL info.
Defender for Cloud Apps – all the logs from DCA and any connected apps.
Alerts – all the alert info from other Defender products.
Defender for Identity – if you use Defender for Identity, all that info is there.
Azure AD Sign In Logs – if you have Azure AD P2 you get all the logon data. For both users and service principals.
The data structure between Sentinel and Advanced Hunting isn’t an exact match, but it is pretty close. Definitely get in there and have a look.
Visualize for impact
A picture is worth a thousand words. With all this data in your tenant you can use visualizations for all kinds of things. You can look for anomalies, try to find strange attack patterns. Of course they are good to report up to executives too. Executive summaries showing total email blocked, or credential attacks stopped always play well. When building visualizations, I want them to explain the data with no context needed. They should be straight forward and easy to understand.
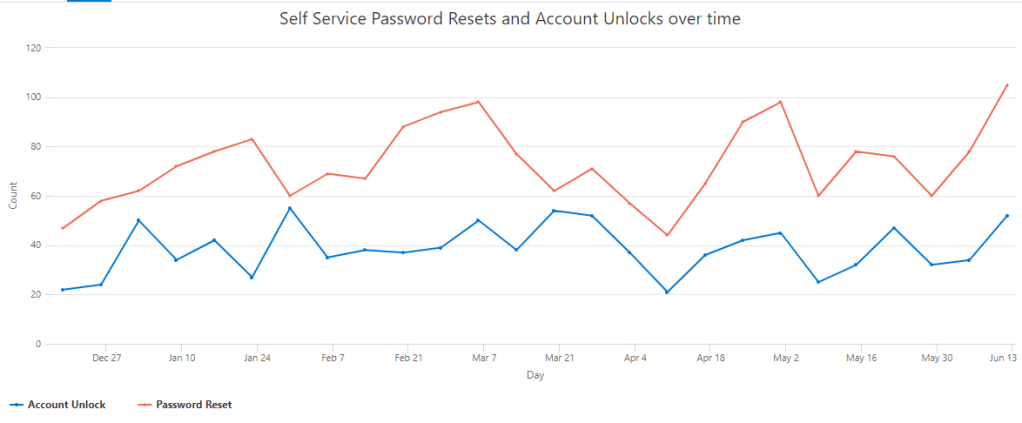
A couple of examples I really think are valuable. The first shows you successful self service password reset and account unlock events. SSPR is such a great time saver for your helpdesk. It is also often more secure than a traditional password reset as the helpdesk can’t be socially engineered. It is also a great visualization to report upward. It is a time saver, and therefore money saver for your helpdesk, and it’s more secure. Big tick.
AuditLogs
| where TimeGenerated > ago (180d)
| where OperationName in ("Reset password (self-service)", "Unlock user account (self-service)")
| summarize
    ['Password Reset']=countif(OperationName == "Reset password (self-service)" and ResultDescription == "Successfully completed reset."),
    ['Account Unlock']=countif(OperationName == "Unlock user account (self-service)" and ResultDescription == "Success")
    by startofweek(TimeGenerated)
| render timechart
    with (
    ytitle="Count",
    xtitle="Day",
    title="Self Service Password Resets and Account Unlocks over time")
With KQL we can even rename our axis and title in the query, copy and paste the picture. Send it to your boss, show him how amazing you are. Get a pay increase.
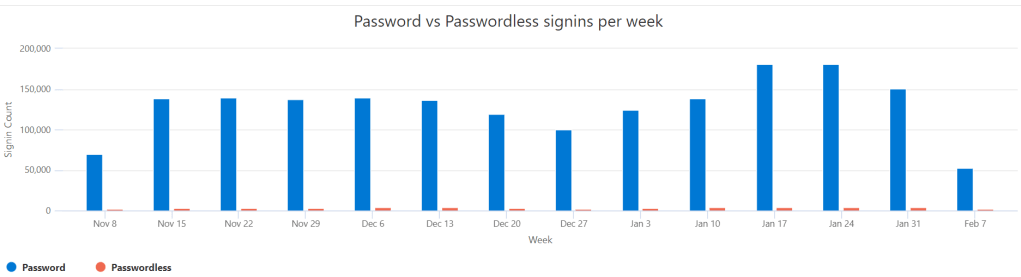
And a similar query, showing password vs passwordless sign ins into your tenant. Maybe your boss has heard of passwordless, or zero trust. Show him how you are tracking to help drive change.
SigninLogs
| where TimeGenerated > ago (180d)
| mv-expand todynamic(AuthenticationDetails)
| project TimeGenerated, AuthenticationDetails
| extend AuthMethod = tostring(AuthenticationDetails.authenticationMethod)
| summarize
    Passwordless=countif(AuthMethod in ("Windows Hello for Business", "Passwordless phone sign-in", "FIDO2 security key", "X.509 Certificate")),
    Password=countif(AuthMethod == "Password")
    by bin(TimeGenerated, 1d)
| render timechart with (title="Passwordless vs Password Authentication", ytitle="Count")
Don’t be afraid of making mistakes or writing ‘bad’ queries
For normal logs in Sentinel, there is no cost to run a query. For Advanced Hunting, there is no cost to query. Your licensing and ingestion fees give you the right to try as much as you want. If you can’t find what you are looking for, then start broadly. You can search across all your data easily.
search "reprise99"
It may take a while, but you will get hits. Then find out what tables they are in. Then narrow down your query. I think of writing queries like a funnel. Start broad, then get more specific until you are happy with it.
In my day to day work and putting together 365 queries to share, I have run just under 60,000 queries in Sentinel itself. Probably another 10,000 or more in Advanced Hunting. A lot of them would have caused errors initially. That is how you will learn! Like anything, practice makes progress.
As I transition to a new role I will keep sharing KQL and other security resources that are hopefully helpful to people. The feedback I have had from everyone has been amazing. So I appreciate you reading and following along.
This was how many queries I ran per day this year!
If you have spent any time in Azure Active Directory, chances are you have stumbled across Azure AD Conditional Access. It is at the very center of Microsoft Zero Trust. At its most basic, it evaluates every sign in to your Azure AD tenant. It takes the different signals that form that sign in. The location a user is coming from, the health of a device. It can look at the roles a user has, or the groups they are in. Even what application is being used to sign in. Once it has all that telemetry, it decides not only if you are allowed into the tenant. It also dictates the controls required to access. You must complete MFA, or your device be compliant. You can block sign ins from particular locations, or need specific applications to be allowed in. When I first looked at Conditional Access I thought of it as a ‘firewall for identity’. While that is somewhat true, it undersells the power of Conditional Access. Conditional Access can make decisions based on a lot more than a traditional firewall can.
Before we go hunting through our data, let’s take a step back. To make sense of that data, here are a couple of key points about Conditional Access.
Many policies can apply to a sign in. The controls for these policies will be added together. For instance, if you have two policies that control access to Exchange Online. The first requires MFA and the second device compliance. Then the policies are added together. The user must satisfy both MFA and have a compliant device.
Each individual policy can have many controls within it, such as MFA and requiring an approved application. They are evaluated in the following order.
A block policy overrides any allow policy, regardless of controls. If one policy says allow with MFA and one says block. The sign in is blocked.
These are important to note because when we look through our data, we will see multiple policies per sign in. To make this data easier to read, we are going to use the mv-expand operator. The guidance says it “Expands multi-value dynamic arrays or property bags into multiple records”. Well, what does that mean? Let’s look at example using the KQL playground. This a demo environment anyone can access. If you log on there, we can look at one sign in event.
SigninLogs
| where CorrelationId == "cadd2fee-a8b0-4daf-9ac8-cc3ae8ebe15b"
| project ConditionalAccessPolicies
We can see many policies evaluated. You see the large JSON structure listing them all. From position 0 to position 11. So 12 policies in total have been evaluated. The problem when hunting this data, is that the position of policies can change. If ‘Block Access Julianl’, seen at position 10 is triggered, it would move up higher in the list. So we need to make our data consistent before hunting it. Let’s use our mv-expand operator on the same sign in.
Our mv-expand operator has expanded each of the policies into its own row. We went from one row, with our 12 policy outcomes in one JSON field, to 12 rows, with one outcome each. We don’t need to worry about the location within a JSON array now. We can query our data knowing it is consistent.
For each policy, we will have one of three outcomes
Success – the controls were met. For instance, a user passed MFA on a policy requiring MFA.
Failure – the controls failed. For instance, a user failed MFA on a policy requiring MFA.
Not applied – the policy was not applied to this sign in. For instance, you had a policy requiring MFA for SharePoint. But this sign in was for Service Now, so it didn’t apply.
If you have policies in report only mode you may see those too. Report only mode lets you test policies before deploying them. So the policy will be evaluated, but none of the controls enforced. You will see these events as reportOnlySuccess, reportOnlyFailure and reportOnlyNotApplied.
User Sign In Insights
Now that we have the basics sorted, we can query our data. The more users and more policies you have, the more data to evaluate. If you were interested in just seeing some statistics for your policies, we can do that. You can use the evaluate operator to build a table showing all the outcomes.
//Create a pivot table showing all conditional access policy outcomes over the last 30 days
SigninLogs
| where TimeGenerated > ago(30d)
| extend CA = parse_json(ConditionalAccessPolicies)
| mv-expand bagexpansion=array CA
| evaluate bag_unpack(CA)
| extend
    ['CA Outcome']=tostring(column_ifexists('result', "")),
    ['CA Policy Name'] = column_ifexists('displayName', "")
| evaluate pivot(['CA Outcome'], count(), ['CA Policy Name'])
These are the same 12 policies we saw earlier. We now have a useful table showing the usage of each.
Using this mv-expand operator further, we can really dig in. This query looks for the users that are failing the most different policies. Is this user compromised and the attackers are trying to find a hole in your policies?
//Find which users are failing the most Conditional Access policies, retrieve the total failure count, distinct policy count and the names of the failed policies
SigninLogs
| where TimeGenerated > ago (30d)
| project TimeGenerated, ConditionalAccessPolicies, UserPrincipalName
| mv-expand ConditionalAccessPolicies
| extend CAResult = tostring(ConditionalAccessPolicies.result)
| extend CAPolicyName = tostring(ConditionalAccessPolicies.displayName)
| where CAResult == "failure"
| summarize
    ['Total Conditional Access Failures']=count(),
    ['Distinct Policy Failure Count']=dcount(CAPolicyName),
    ['Policy Names']=make_set(CAPolicyName)
    by UserPrincipalName
| sort by ['Distinct Policy Failure Count'] desc
One query I really love running is the following. It hunts through all sign in data, and returns policies that are not in use.
//Find Azure AD conditional access policies that have no hits for 'success' or 'failure' over the last month
//Check that these policies are configured correctly or still required
SigninLogs
| where TimeGenerated > ago (30d)
| project TimeGenerated, ConditionalAccessPolicies
| mv-expand ConditionalAccessPolicies
| extend CAResult = tostring(ConditionalAccessPolicies.result)
| extend ['Conditional Access Policy Name'] = tostring(ConditionalAccessPolicies.displayName)
| summarize ['Conditional Access Result']=make_set(CAResult) by ['Conditional Access Policy Name']
| where ['Conditional Access Result'] !has "success"
    and ['Conditional Access Result'] !has "failure"
    and ['Conditional Access Result'] !has "unknownFutureValue"
| sort by ['Conditional Access Policy Name'] asc
This query uses the summarize operator to build a set of all the outcomes for each policy. We create a set of all the outcomes for that policy – success, not applied, failure. Then we exclude any policy that has a success or a failure. If we see a success or failure event, then the policy is in use. If all we see is ‘not Applied’ then no sign ins have triggered that policy. Maybe the settings aren’t right, or you have excluded too many people?
We can even use some of the more advanced operators to look for anomalies in our data. The series_decompose_anomalies operator lets us hunt through time series data. From that data is flags anything it believes is an anomaly.
//Detect anomalies in the amount of conditional access failures by users in your tenant, then visualize those conditional access failures
//Starttime and endtime = which period of data to look at, i.e from 21 days ago until today.
let startdate=21d;
let enddate=1d;
//Timeframe = time period to break the data up into, i.e 1 hour blocks.
let timeframe=1h;
//Sensitivity = the lower the number the more sensitive the anomaly detection is, i.e it will find more anomalies, default is 1.5
let sensitivity=2;
//Threshold = set this to tune out low count anomalies, i.e when total failures for a user doubles from 1 to 2
let threshold=5;
let outlierusers=
SigninLogs
| where TimeGenerated between (startofday(ago(startdate))..startofday(ago(enddate)))
| where ResultType == "53003"
| project TimeGenerated, ResultType, UserPrincipalName
| make-series CAFailureCount=count() on TimeGenerated from startofday(ago(startdate)) to startofday(ago(enddate)) step timeframe by UserPrincipalName
| extend outliers=series_decompose_anomalies(CAFailureCount, sensitivity)
| mv-expand TimeGenerated, CAFailureCount, outliers
| where outliers == 1 and CAFailureCount > threshold
| distinct UserPrincipalName;
//Optionally visualize the anomalies
SigninLogs
| where TimeGenerated between (startofday(ago(startdate))..startofday(ago(enddate)))
| where ResultType == "53003"
| project TimeGenerated, ResultType, UserPrincipalName
| where UserPrincipalName in (outlierusers)
| summarize CAFailures=count()by UserPrincipalName, bin(TimeGenerated, timeframe)
| render timechart with (ytitle="Failure Count",title="Anomalous Conditional Access Failures")
I am not sure I would want to alert on every Conditional Access failure. You are likely to have a lot of them. But what about users failing Conditional Access to multiple applications, in a short time period? This query finds any users that get blocked by Conditional Access to 5 of more unique applications within an hour.
SigninLogs
| where TimeGenerated > ago (1d)
| project TimeGenerated, ConditionalAccessPolicies, UserPrincipalName, AppDisplayName
| mv-expand ConditionalAccessPolicies
| extend CAResult = tostring(ConditionalAccessPolicies.result)
| extend CAPolicyName = tostring(ConditionalAccessPolicies.displayName)
| where CAResult == "failure"
| summarize
    ['List of Failed Application']=make_set(AppDisplayName),
    ['Count of Failed Application']=dcount(AppDisplayName)
    by UserPrincipalName, bin(TimeGenerated, 1h)
| where ['Count of Failed Application'] >= 5
Audit Insights
The second key part of Conditional Access monitoring is auditing changes. Much like a firewall, changes to Conditional Access policies should be alerted on. Accidental or malicious changes to your policies can decrease your security posture significantly. Any changes to policies are held in the Azure Active Directory audit log table.
Events are logged under three different categories.
Add conditional access policy
Update conditional access policy
Delete conditional access policy
A simple query will return any of these actions in your environment.
AuditLogs
| where TimeGenerated > ago(7d)
| where OperationName in ("Update conditional access policy", "Add conditional access policy", "Delete conditional access policy")
You will notice one thing straight away. It is difficult to work out what has actually changed. Most of the items are stored as GUIDs buried in JSON. It is hard to tell the old setting from the new. I wouldn’t even bother trying to make sense of it. Instead let’s update our query to this.
Now we are returned the name of our policy, and its Id. Then we can jump into the Azure portal and see the current settings. This is where your knowledge of your environment is key. If you know the ‘Sentinel 101 Test’ policy requires MFA for all sign ins, and someone has changed the policy, you need to investigate.
We can add some more logic to our queries. For instance, we could alert on changes made by people who have never made a change before. Has an admin has been compromised? Or someone not familiar with Conditional Access was asked to make a change.
//Detects users who add, delete or update a Azure AD Conditional Access policy for the first time.
//First find users who have previously made CA policy changes, this example looks back 90 days
let knownusers=
    AuditLogs
    | where TimeGenerated > ago(90d) and TimeGenerated < ago(1d)
    | where OperationName in ("Update conditional access policy", "Add conditional access policy", "Delete conditional access policy")
    | extend Actor = tostring(parse_json(tostring(InitiatedBy.user)).userPrincipalName)
    | distinct Actor;
//Find new events from users not in the known user list
AuditLogs
| where TimeGenerated > ago(1d)
| where OperationName in ("Update conditional access policy", "Add conditional access policy", "Delete conditional access policy")
| extend Actor = tostring(parse_json(tostring(InitiatedBy.user)).userPrincipalName)
| extend ['Policy Name'] = tostring(TargetResources[0].displayName)
| extend ['Policy Id'] = tostring(TargetResources[0].id)
| where Actor !in (knownusers)
| project TimeGenerated, Actor, ['Policy Name'], ['Policy Id']
We can even look for actions at certain times of the day, or particular days. This query looks for changes after hours or on weekends.
//Detect changes to Azure AD Conditional Access policies on weekends or outside of business hours
let Saturday = time(6.00:00:00);
let Sunday = time(0.00:00:00);
AuditLogs
| where OperationName in ("Update conditional access policy", "Add conditional access policy", "Delete conditional access policy")
// extend LocalTime to your time zone
| extend LocalTime=TimeGenerated + 5h
// Change hours of the day to suit your company, i.e this would find activations between 6pm and 6am
| where dayofweek(LocalTime) in (Saturday, Sunday) or hourofday(LocalTime) !between (6 .. 18)
| extend ['Conditional Access Policy Name'] = tostring(TargetResources[0].displayName)
| extend Actor = tostring(parse_json(tostring(InitiatedBy.user)).userPrincipalName)
| project LocalTime,
    OperationName,
    ['Conditional Access Policy Name'],
    Actor
| sort by LocalTime desc
Managing Exclusions
Like any rules or policies in your environment, there is a chance you will need exclusions. Conditional Access policies are very granular in what you can include or exclude. You can exclude on locations, or OS types, or particular users. It is important to alert on these exclusions, and ensure they are fit for purpose. For this example I have excluded a particular group from this policy.
We can see that an ‘Update conditional access policy’ event was triggered. Again, the raw data is hard to read. So jump into the portal and check out what has been configured. Now, one very important note here. If you add a group exclusion to a policy, it will trigger an event you can track. However, if I then add users to that group, it won’t trigger a policy change event. This is because the policy itself hasn’t changed, just the membership of the group. From your point of view you will need to have visibility to both events. If your policy is changed you would want to know. If 500 users were added to the group, you would also want to know. So we can query group addition events with the below query.
    AuditLogs
    | where OperationName == "Add member to group"
    | extend Actor = tostring(parse_json(tostring(InitiatedBy.user)).userPrincipalName)
    | extend Target = tostring(TargetResources[0].userPrincipalName)
    | extend GroupName = tostring(parse_json(tostring(parse_json(tostring(TargetResources[0].modifiedProperties))[1].newValue)))
    | where GroupName has "Conditional Access Exclusion"
    | project TimeGenerated, Actor, Target, GroupName
When you are creating exclusions, you want to limit those exclusions down as much as possible. We always talk about the theory of ‘least privilege’. With exclusions, I like to think of them as ‘least exclusion’. If you have a workload that needs excluding, then can we exclude a particular location, or IP, or device? This is a better security stance than a blanket exclusion of a whole policy.
You can often use two policies to achieve the best outcome. Think of the example of Exchange Online, you want to enforce MFA for everyone. But you have a service account that does some automation, and it keeps failing MFA. It signs on from one particular IP address. If you exclude it from your main policy then it is a blanket exclusion. Instead build two policies.
Policy 1 – Require MFA for Exchange Online
Includes all users, excludes your service account
Includes all locations
Includes Exchange Online
Control is require MFA
Policy 2 – Exclude MFA for Exchange Online
Includes only your service account
Includes all locations, excludes a single IP address
Includes Exchange Online
Control is require MFA
As mentioned at the outset, Conditional Access policies are combined. So this combined set of two policies achieves what we want. Our service account is only excluded from MFA from our single IP address. Let’s say the credentials for that account are compromised. The attacker tries to sign in from another location. When it signs into Exchange Online it will prompt for MFA.
If we had only one policy we don’t get the same control. If we had a single policy and excluded our service account, then it would be excluded from all locations. If we had a single policy and excluded the IP address, then all users would be excluded from that IP. So we need to build two policies to achieve the best outcome.
Of course we want to balance single exclusions with the overhead of managing many policies. The more policies you have, the harder it is to work out the effect of changes. Microsoft provides a ‘what-if’ tool for Conditional Access. It will let you build a ‘fake’ sign in and tell you which policies are applied.
Recommendations
Learning to drive and audit Conditional Access is key to securing Azure AD. Having built a lot of policies over the years, here are some of my tips.
Never, ever lock yourself out of the Azure portal! You get a UI warning if it believes you may be doing this. Support will be able to get you back in, but it will take time. Exclude your own account as you build policies.
Create broad policies that cover the most use cases. If your standard security stance is require MFA to access SSO apps then build one policy. Apply that policy to as many apps and users as possible. There is no need to build an individual policy for each app.
When you create exclusions, use the principal of ‘least exclusion’. When you are building an exclusion, have a think about the flow on effect. Will it decrease security for other users or workloads? Use multiple policies where practical to keep your security tight.
Audit any policy changes. Find the policy that was changed and review it in the Azure portal.
Use the ‘what-if’ tool to help you build policies. Remember that multiple policies are combined, and controls within a single policy have an order of operations.
Blocks override any allows!
Try not to keep ‘report only’ policies in report only mode too long. Once you are happy, then enable the policy. Report only should only be there to validate your policy logic.
If you use group exclusions, then monitor the membership of those groups. Users being added to a group that is excluded from a policy won’t trigger a policy change event. Keep on top of how many people are excluded. Once someone is in a group they tend to stay there forever. If an exclusion is temporary, make sure they are removed.
If you are looking at using Microsoft Sentinel, then Active Directory is likely high on your list of sources to onboard. If you already use it, you probably spend a fair bit of time digging through Active Directory logs. Despite Microsoft’s push to Azure Active Directory, on premise Active Directory is still heavily used. You may have migrated off it for cloud workloads, but chances are you still use it on premises. Attacking and defending Active Directory is a such a broad subject it is basically a speciality within cyber security itself.
You can onboard Active Directory logs a number of ways, they all have their pros and cons. The purpose of this post is to show you the different options and hopefully you can make an informed decision of which way to go.
You may have heard reference to the Log Analytics agent, or the Azure Monitor Agent. You may already be licensed for Defender for Identity too. Do I need these all? Can I use multiple?
Let’s break it down.
So in general to ship logs to Sentinel from Active Directory you will need an agent installed. You could be doing native Windows Event Forwarding, but to keep it simple, let’s look at the agent options.
The events written to Sentinel will be an exact match for what are logged on your domain controllers. If EventId 4776 is logged on the server, Sentinel will retain an exact copy. These are written to the SecurityEvent table.
Which EventIds you ingest depends on what tier you choose here.
There is no way to customize the logging apart from those predefined levels.
The cost will depend what logging level you choose. If you choose all events and you have a busy domain, it can be significant.
Events will be in near real time.
This agent is end of life in 2024.
Often also referred to as the Microsoft Monitoring Agent.
The events written to Sentinel will be an exact match for what are logged on your domain controllers. If EventId 4776 is logged on the server, Sentinel will retain an exact copy. These are written to the SecurityEvent table.
Which EventIds you ingest you can fully customize. This is done via Data Collection Rules. If you only want specific EventIds you can do that. You can even filter EventIds on specific fields, like process names.
Non Azure VM workloads need to be enrolled into Azure Arc to use this agent. This includes on premises servers, or virtual machines in other clouds.
The cost will depend what logging level you configure via your rules.
Events will be in near real time.
At the time of writing this post, the Azure Monitor agent is still missing some features compared to the Log Analytics agents. View the limitations here.
If you have the Defender for Identity agent installed you can leverage that in Sentinel.
You can send two types of data from the Defender for Identity service to Sentinel.
Alerts from Defender for Identity are written to the SecurityAlert table.
For instance, a reconnaissance or golden ticket usage alert. This is only the alert and associated entities. No actual logs are sent to this table.
This data is free to ingest to Sentinel. You can enable it via the ‘Microsoft Defender for Identity’ data connector.
Summarized event data can also be written back to Sentinel. These are the same logs that appear in Advanced Hunting if you have previously used that. They are –
IdentityLogonEvents – will show you logon events, both in Active Directory and across Office 365.
IdentityDirectoryEvents – will show you directory events, such as group membership changing, or an account being disabled.
IdentityQueryEvents – will show you query events, such as SAMR or DNS queries.
This data is not free to ingest. You can enable it via the ‘Microsoft 365 Defender’ data connector under ‘Microsoft Defender for Identity’
There is no ability to customize these events. They will change or update only as the Defender for Identity product evolves.
The cost will depend on the size of your environment of course. It should be significantly less than raw logs however. We will explore this soon.
There is a delay in logs as they are sent to the Defender for Identity service, then to Sentinel.
So the first two agents are pretty similar. The Azure Monitor agent is the natural evolution of the Log Analytics agent. Using the new one gives you the ability to customize your logs, which is a huge benefit. It is also easy to have different collection rules. You could take all the logs from your critical assets. Then you could just take a subset of events from other assets. You also get the added Azure Arc capability if you want to leverage any of it.
Data Coverage
For the Log Analytics and Azure Monitor agents the coverage is straight forward. Whatever you configure you will ingest into Sentinel. For the Log Analytics agent, this will depend on which logging tier you select. For the Azure Monitor Agent it will depend on your Data Collection Rules.
For Defender for Identity it gets a little trickier. We have no control over the events that are sent to Sentinel. I imagine over time these change and evolve as the product does. The best way to check is to have a look at some of the actions that are being logged. You can run this query to summarize all the events in your tenant. This will also work in Advanced Hunting.
IdentityDirectoryEvents
| where TimeGenerated > ago(7d)
| summarize count()by ActionType
Here is a sample of a few of the events we see.
Some are the same as what we see with standard logs. Group membership changed, account password changed etc. The difference is we don’t see all the EventIds that make up these activities. These Defender for Identity events are similar to Azure Active Directory audit logs. We don’t see what is happening behind the scenes in Azure AD. We do see activities though, such as users being added to groups.
Just because you aren’t getting the raw logs, doesn’t mean it’s bad. In fact there are some things unique to these events we don’t get from actual domain controller logs. Defender for Identity is a really great service and we benefit from the correlation it does.
Have a look at some of these activities – encryption changes, WMI execution, there are many interesting findings. Potential lateral movement path identified is really great too. Defender for Identity is by no means BloodHound for mapping attack paths. It does still provide interesting insights though. Without Defender for Identity doing the hard work for you, you would need to write the logic yourself.
Data Size
Ingestion costs are always something to keep an eye on, and Active Directory logs can be noisy. With the Log Analytics agent your data costs will basically be inline with what tier of logging you choose. The higher the tier, and the larger your domain, the more it will ingest. The Azure Monitor agent is much the same. However you get the added benefit of being able to configure what logs you want. Given domain controllers are critical assets you are likely to want most EventIds though.
With Defender for Identity, it is different. It will only send back certain audit events. The size and complexity of your domain is still relevant though. The more audit events you generate, the more that will be ingested back to Sentinel. What may be more useful however is the relative size of the logs. Using KQL we can calculate the difference between normal logs and those from Defender for Identity. You may send non DCs to the same SecurityEvent table. If so, just include a filter in your query to only include DCs.
union withsource=TableName1 SecurityEvent, Identity*
| where TimeGenerated > ago(7d)
| where Computer contains "DC" or isempty( Computer)
| summarize Entries = count(), Size = sum(_BilledSize), last_log = datetime_diff("second",now(), max(TimeGenerated)), estimate  = sumif(_BilledSize, _IsBillable==true)  by TableName1, _IsBillable
| project ['Table Name'] = TableName1, ['Table Entries'] = Entries, ['Table Size'] = Size,
          ['Size per Entry'] = 1.0 * Size / Entries, ['IsBillable'] = _IsBillable, ['Last Record Received'] =  last_log , ['Estimated Table Price'] =  (estimate/(1024*1024*1024)) * 0.0
 | order by ['Table Size']  desc
In a lab environment with a few DCs you can see a significant difference in size. Every environment will vary of course, but your Defender for Identity logs will be much smaller.
Log Delay
A key focus for you may be how quickly these logs arrive at Sentinel. As security people, some events are high enough risk we want to know instantly. When using either the Log Analytics or Azure Monitor agent, that happens within a few minutes. The event needs to be logged on the DC itself. Then sent to Sentinel. But it should be quick.
Events coming in from Defender for Identity first need to be sent to that service. Defender for Identity then needs to do its correlation and other magic. Then the logs need to be sent back to Sentinel. Over the last few days I have completed some regular activities. Then calculated how long it takes to go to Defender for Identity, then to Sentinel.
Adding a user to a group – took around 2.5 hours to appear in Sentinel on average.
Disabling a user – also took around 2.5 hours to appear in Sentinel.
Changing job title – took around 4 hours to appear in Sentinel.
These time delays may change depending on how often certain jobs run on the Microsoft side. The point is that they are not real time, so just be aware.
Query Differences
One of the biggest differences between the Log Analytics/Azure Monitor agent and Defender for Identity is data structure. For the Log Analytics and Azure Monitor agents the data is a copy of the log on your server. Take EventId 4725, a user account was disabled. That is going to look the same in Event Viewer as in Sentinel. We can use simple KQL to parse what we care about.
With Defender for Identity, the raw event data has been converted to an activity for us. We don’t need to search for specific EventIds. There is an ‘account disabled’ activity.
We can also see here the differences between what data we are returned. Defender for Identity just tells us that an account was disabled. It doesn’t tell us who did it. Whereas the logs taken from one of the other agents has far more information.
Interested in group membership changes? When you look at the logs straight from a domain controller there are lots of EventIds you will need. Active Directory tracks these differently depending on the type of group. EventId 4728 is when a user is added to a security-enabled global group. Then you will have a different EventId for a security-enabled local group. Then the same for group removals. And so on. We can capture them all with this query.
SecurityEvent
| project TimeGenerated, EventID, AccountType, MemberName, SubjectUserName, TargetUserName, Activity, MemberSid
| where EventID in (4728,4729,4732,4733,4756,4757)
In Defender for Identity, these events are rolled up to a single activity. It logs these as ‘Group Membership changed’. Regardless of group type or whether it was someone being added or removed. That means we can return all group changes in a single, simple query.
You may be thinking that the Defender for Identity logs are ‘worse’. That isn’t true, they are just different. They also provide you some insights over and above what you get from security events directly.
Defender for Identity does lateral movement path investigation. This won’t give you the insights of a tool like BloodHound. It can still be useful though. For example, you can find which of your devices or users have the most lateral movement paths identified.
IdentityDirectoryEvents
| where ActionType == "Potential lateral movement path identified"
| summarize arg_max(TimeGenerated, *) by ReportId
| summarize Count=count()by AccountUpn, DeviceName
| sort by Count desc
Events that are painful to find in regular logs can be simple to find in the Defender for Identity events. For instance when accounts have their encryption types changed. Parsing that from the security events is hard work. With the Defender for Identity events it is really simple.
It will even show you when a device changes operating system version.
IdentityDirectoryEvents
| where ActionType == "Device Operating System changed"
| extend ['Previous OS Version'] = tostring(AdditionalFields.["FROM Device Operating System"])
| extend ['Current OS Version'] = tostring(AdditionalFields.["TO Device Operating System"])
| project TimeGenerated, TargetDeviceName, ['Previous OS Version'], ['Current OS Version']
Summary
Hopefully that sheds some light on the various options. If you need real time detection, then the only real option is the Log Analytics or Azure Monitor agent. The delay with logs being sent via Defender for Identity means you may be too late spotting malicious activity. Which of the agents you choose between the two is up to you.
If you need the ability to customize which logs you want, then the Azure Monitor agent is for you. Keep in mind for non Azure workloads, you will require the machine enrolled to Azure Arc.
The Log Analytics agent is definitely easier to deploy today. Keep in mind though, you are limited to your logging tiers. The agent is also end of life in a couple of years.
The Defender for Identity agent provides a different set of information. If you don’t have the requirement (or budget) to log actual events then it is still valuable. If you already use Defender for Identity and are starting to explore Sentinel, they are a good starting point. The cost will be significantly less than the other two agents. Also it does a lot of the hard work for you by doing its own event correlation.
You can also use multiple agents! Given the Azure Monitor agent is replacing the Log Analytics agent, they obviously perform similar functions. Unless you have very specific requirements you probably don’t need both of them. But you can definitely have one of them and the Defender for Identity agent running. You obviously pay the ingestion charges for both. But as we saw above, the Defender for Identity traffic is relatively small. If you go that route you get the logs for immediate detection and you also get the Defender for Identity insights.
Honeypots have been around for a long time in InfoSec. The idea is that you set up some kind of infrastructure – maybe a file server or virtual machine. It isn’t a ‘real’ server, it is designed just to be hidden and should anyone find it, you will be alerted. The idea is to catch potential reconnaissance occurring in your environment. Maybe a machine has been compromised and the attackers are looking to pivot to some easy targets. So they scan your environment for file shares, or VNC, something to move to.
Traditional honeypots may have been actual physical servers, or maybe a desktop acting as a server. With virtualization taking over they became a VM. You did need to manage that device though. That meant power (or a VM), installing an operating system, and patching it. It had to be configured as a honeypot too. So if you wanted it to be a file server, you needed to configure it as a file server. Like any security tooling, there was a chance of noise in your alerts too, even from a honeypot. There is nothing less valuable in cyber security than a product that just sends noise. The real alerts will definitely be missed.
Technology has come along way though. We have the ability to spin infrastructure up in the cloud easily. We can also manage this infrastructure in a more modern way. If we want some really great honeypots, there is no need to build and maintain them ourselves.
One of my absolute favourite blue team tools are Thinkst Canaries. They are what a honeypot should be in 2022. Despite being a blog focussed on Microsoft Sentinel, I like to think of myself as technology agnostic. Like many of you, you probably use a real mix of products from different vendors.
Very few security tools you go from deployment to getting quality alerts so quickly. Usually you have some kind of learning period. Or you have to tune alerts down, or whitelist that one server that always triggers something. I think with a lot of tools you never get to that point. They are forever just noise.
I want to show you how easy it is to setup some Canaries in Azure and configure them. We will then integrate that with Microsoft Sentinel (of course). Then finally, I want to show you the power of Canarytokens. These are individual little honeypots we can deploy at scale. The plan is to use Microsoft Endpoint Manager and some PowerShell to deploy a unique Canarytoken to every device on the network. The team even have a free offering which I will show you.
The setup
When you first login to your console, you will see it is pretty bare. It won’t be for long. One recent addition to the console is being able to group your Canaries into flocks. You can do this to allow different notification settings per flock. Maybe you have different locations and different teams you want to respond. You could create groups for them.
To keep it simple though, let’s assume we are the lone cyber security person in our organization. We will just use the default flock.
Let’s launch our first Canary.
We get all kinds of options – on premise virtual appliances, cloud, Kubernetes, that depends which license you buy.
For this example we will choose Azure, they take just minutes to spin up and be ready.
You are best to launch the Canary from within a browser where you are already signed into Azure. When you hit Launch you are first prompted to install an Azure AD app. If you purchase Canaries for Azure the team will ask for your tenant id to make things even easier. This is just a once off to help with the deployment. The deployment script will run as this Azure AD app so you don’t need to play around with credentials. You can also let them know which region(s) you wish to deploy to and it will be preconfigured for you.
Next up you need to decide where you want to put your Canary in Azure. This is going to be very unique to your environment. But have a think about placement and what makes the most sense. This will need to be contactable by potential bad actors. You may want to isolate it from other workloads though.
Once you are set, put in your resource group name. Just make sure the Azure AD application you just installed has the right access in Azure. It will need to be a ‘contributor’ on the resource group you want to deploy to. That way it can deploy automatically for you. There are some options there for specifying different tenant id’s and existing Vnets. Just make sure your app has sufficient privilege to join machines to existing subnets if you go that route.
Once you fill it in you will be generated a script to deploy with. Bash or PowerShell both work. So fire up a Cloud Shell and paste it in.
After you run your script your new Canary should be ready to hatch. Add it to confirm.
You should see the resources appear in your Azure resource group.
And your Canary ready to configure in the console.
There is a cost to run a virtual machine in Azure of course. This is a Linux device and quite low specifications so it isn’t very expensive. Canaries run on a B1lS Azure instance, which are the baby of the Azure VM fleet. Costs can be expected to be between 3$ and 6$ per month depending on region.
The Configuration
Now this is where we see the really cool stuff. If you had an old school honeypot this is where it was a pain. If you wanted a Windows server then you had to install Windows on it. Then make it a file server. Add some files in there. Then add some kind of alerting. Instead we are just going to drive all that configuration from our console.
We can change its name, and its ‘personality’, its location.
Let’s make our Canary a Windows file server. But because we are really bad admins, we also are going to enable VNC.
When you configure a Canary as a file server, it will preload you some fake documents. You can edit them or add your own too. So we start with some fake Cisco and Windows documentation. And of course the PDF of how much the executives earn. Who wouldn’t open that? You can join it to your domain if you like to make it a little more discoverable. You can also add a DNS record for it into your DNS, so it’s easier to find.
As mentioned, we also left RDP running.
And we enabled VNC.
Deploy your configuration and you will get a little orange icon showing the changes are applying.
Now our Canary is sitting there ready to catch people. If I browse to the file share I can see the same files sitting there.
Of course, I couldn’t help myself, I had to know how much my boss earned so I opened up the PDF, and got detected.
If you connected via RDP or VNC you would get a different alert for those events.
Change personalities
Don’t want this to be a Windows server anymore? Easy, let’s make it a network device that someone may try to SSH to. We can change the personality of the device to a Cisco router.
When we do that, it enables a web server and SSH on the Canary for us.
We can even add some custom branding if we want. Apply that config to the Canary. In a minute of two you now have a fake Cisco router ready to catch some network recon. It takes just a couple of minutes to change the personality. Way faster than rebuilding a VM or adding new features to Windows. All the previous alerting you configured remains for you. You will just start getting different alerts because it is now a router.
When I connect via putty, I hit our device and see our message.
And again, I triggered an alarm.
If you have a look at the personalities, there are a heap of options. Pretty much every version of Windows. Linux distros. Network appliances. Even some really cool things like SCADA systems.
I have showed just a couple of examples but there a plenty of more specific services you can setup. You could configure it as a FTP or TFTP server, a time server, even a Git repo. It even allows for a custom TCP service if you have more specific requirements.
You also have the ‘Christmas Tree’ option, where you turn on everything. For your notifications you can set up everything you would expect. You can send an email, or an SMS on alerts. You can also get weekly digests for all activity. If you have an existing notification system you grab a syslog feed or query an API. There are even prebuilt webhooks into Slack or Teams.
Integrate with Sentinel
The integration with Sentinel is really simple, we are just going to send a webhook on each alert. From that webhook we will ingest the record into a custom table. Then we have the power of KQL to hunt and search like normal. Our Logic App could not be more basic –
3 simple steps to get the data into Sentinel.
Create a Logic App with the ‘When a HTTP request is received’ trigger.
Parse the payload.
Send that data to Sentinel to a custom table.
Then on the Canary side, add a generic webhook. Use the address in the first step of your Logic App.
Then when a Canary is triggered you will get the alert into Sentinel.
Depending on the personality of your Canary you may get additional detail too. If you have multiple Canaries all the alerts will be centralized. You could look at the hostname or account name that comes in to the alert and investigate that user in Sentinel. Or you could look up more information about the device they are coming from.
If you were interested in getting more information than just alerts into Sentinel, you could also send the syslog feed as well.
Canarytokens – Deception at scale
So we have covered in detail the Canary products. Thinkst also offer another product called Canarytokens. These ones you may be familiar with. Instead of being a full Canary these are just a single token that we can use for similar deception. When we say token, we could mean a Word document, or a DNS name, a PDF. Just a single item, or ‘token’. You can even generate them for free – https://canarytokens.org/generate
There are plenty of different options
For example, you could generate a PDF file. You provide it an email address or webhook (or both). You can use the same webhook to send the data to Sentinel if you want.
Once generated it is free to download.
Then you can rename the file if you want, maybe call it SysAdmin-Passwords.pdf, then put it somewhere ready to be found. When opened you will get an alert & webhook sent. That is really fantastic, but we want to go big with this. Maybe we want to put a Canarytoken on every single device in our environment. Let’s turn every device we have into a unique honeypot.
The free Canarytokens are amazing, but it isn’t really practical to generate them at scale. To generate them at scale we need to use the Canarytoken factory.
If we own a Canary product then we get access to the Canarytoken factory. That means we can generate Canarytokens using an API. That is what will let us generate our tokens for all our devices easily.
When you perform this you will be returned a factory_auth value. This is your key to use the Canarytoken factory. So take note of it.
Deploy a unique Canarytoken to each device.
There are a number of ways to achieve this and it depends how you manage your devices. This example will use Microsoft Endpoint Manager to run PowerShell on each device. We do this using the proactive remediation feature. When proactive remediation runs on each machine it checks if it already has a token. If it does, then the script won’t do anything. If a token is missing, it will connect to the Canarytoken factory and retrieve one. It then places it on the machine for us.
These tokens are generated from your Canary console so inherit the same notification settings. We already set up our Sentinel integration. When any of these Canarytokens are triggered, it will flow to Sentinel via our same Logic App.
Also we need to be able to identify which Canarytoken was triggered. If we have 1000 laptops, then we need a unique name for each one. Otherwise we will never know which was device was compromised.
Worried about security of your API keys? The Canaryfactory uses a different credential than your regular API which only has permissions to generate more tokens. If it was to be stolen, all you could do is generate more tokens with it.
If you go the PowerShell route to deploy the Canarytokens, then it’s easy. Thinkst are nice enough to write the PowerShell for us here.
What type of token you want to use on your devices depends on what is useful to you. Maybe a fake password list, or fake AWS credentials. You should place it somewhere that only attackers or perhaps insider threats would access. You don’t want every user triggering it constantly.
Have a play with the script and get it right for your environment. Try some different tokens and different locations. Then when ready deploy it out. If you use proactive remediation there is a good guide here. You could use SCCM or any other tool to achieve it also. You could make it part of your build process as you deploy new machines.
Now you have an individual Canarytoken on each of your devices waiting to be found. Have 5000 laptops, now you have 5000 Canarytokens. Each one is unique to the device it is located on.
If you use the AWS credentials example, when the file is opened nothing happens. However if someone uses the credentials you then get an alert. Maybe a regular user stumbles across them and likely doesn’t know what they are for. A malicious actor though may think they have found the keys to your AWS kingdom. When they connect, your Canarytoken will fire and Sentinel will alert you. You can isolate the device, contact the user, have a look what IP the token was triggered from.
Other cool use cases
It is easy to think of a Canarytoken as just a file that we put somewhere to be found. But using the AWS credential example we can put them in all kinds of places.
Use Confluence to store documentation? Put some AWS credentials or another Canarytoken in there.
Use Teams or Slack for collaboration? Why not create a Team or a group chat and leave something laying around in there to be found.
Maybe some fake DNS records that point to something that looks interesting to an attacker? passwordvault.yourdomain.com or something similar.
Have a code repo like GitHub or GitLab? Leave some credentials laying around for someone to trip.
Use Azure DevOps or another pipeline product? Maybe you could leave something in there too.
There are plenty of really great ideas, and in your environment I am sure you can think of a heap more.
Summary
I have given you just a few examples of using deception with the Thinkst products. Hopefully you have come up with some ideas where you could use them. If I was starting out with them I would take this approach.
Drop them around your network and see if you get any alerts. You may be surprised how much people look around.
Think about your cloud – like Office 365, or Slack or GitHub as an extension of your network. You can place tokens in there too.
You can see the pricing for the Canary products themselves on the website
If you have gone through back and forth with vendors on pricing you know what that dance can be like. I appreciate the cost is right there for you to look at.
I personally think they are value for money, but everyone has a different budget and different priorities.
If you decide to go virtual then just add in the cost of running a few small virtual machines.
If you use Sentinel then hook the alerts up via a Logic App.
If you centralize your alerting through Sentinel then regardless of Canary type you will have consistency. Whether a full Canary or a Canarytoken, your alerts come through the same channel.
If you are interested in doing the mass Canarytoken deployment then definitely use the Canarytoken factory. It will scale as large as you need it to.
This article is presented as part of the #AzureSpringClean event. The idea of #AzureSpringClean is to promote well managed Azure environments. This article will focus on Azure Active Directory and how we can leverage KQL to keep things neat and tidy.
Much like on premise Active Directory, Azure Active Directory has a tendency to grow quickly. You have new users or guests being onboarded all the time. You are configuring single sign on to apps. You may create service principals for all kinds of integration. And again, much like on premise Active Directory, it is in our best interest to keep on top of all these objects. If users have left the business, or we have decommissioned applications then we also want to clean up all those artefacts.
Microsoft provide tools to help automate some of these tasks – entitlement management and access reviews. Entitlement management lets you manage identity and access at scale. You can build access packages. These access packages can contain all the access a particular role needs. You then overlay just in time access and approval workflows on top.
Access reviews are pretty self explanatory. They let you easily manage group memberships, application and role access. You can schedule access reviews to make sure people only keep the appropriate access.
So if Microsoft provide these tools, why should we dig into the data ourselves? Good question. You may not be licensed for them to start with, they are both Azure AD P2 features. You also may have use cases that fall outside of the capability of those products. Using KQL and the raw data, we can find all kinds of trends in our Azure AD tenant.
First things first though, we will need that data in a workspace! You can choose which Log Analytics workspace from the Azure Active Directory -> Diagnostics setting tab. If you use Microsoft Sentinel, you can achieve the same via the Azure Active Directory data connector.
You can pick and choose what you like. This article is going to cover these three items –
SignInLogs – all your normal sign ins to Azure AD.
AuditLogs – all the administrative activities in your tenant, like guest invites and redemptions.
ServicePrincipalSignInLogs – sign ins for your Service Principals.
Two things to note, you need to be Azure AD P1 to export this data and there are Log Analytics ingestion costs.
Let’s look at seven areas of Azure Active Directory –
Users and Guests
Service Principals
Enterprise Applications
Privileged Access
MFA and Passwordless
Legacy Auth
Conditional Access
And for each, write some example queries looking for interesting trends. Hopefully in your tenant they can provide some useful information. The more historical data you have the more useful your trends will be of course. But even just having a few weeks worth of data is valuable.
To make things even easier, for most of these queries I have used the Log Analytics demo environment. You may not yet have a workspace of your own, but you still want to test the queries out. The demo environment is free to use for anyone. Some of the data types aren’t available in there, but I have tried to use it as much as possible.
You can access the demo tenant here. You just need to login with any Microsoft account – personal or work, and away you go.
Users and Guests
User lifecycle management can be hard work! Using Azure AD guests can add to that complexity. Guests likely work for other companies or partners. You don’t manage them fully in the way you would your own staff.
Let’s start by finding when our users last signed in. Maybe you want to know when users haven’t signed in for more than 45 days. We can even retrieve our user type at the same time. You could start by disabling these accounts.
SigninLogs
| where TimeGenerated > ago(365d)
| where ResultType == "0"
| summarize arg_max(TimeGenerated, *) by UserPrincipalName
| project TimeGenerated, UserPrincipalName, UserType, ['Days Since Last Logon']=datetime_diff("day", now(),TimeGenerated)
| where ['Days Since Last Logon'] >= 45 | sort by ['Days Since Last Logon'] desc
We use a really useful operator in this query called datetime_diff. It lets us calculate the time between two events in a way that is easier for us to read. So in this example, we calculate the difference between the last sign in and now in days. UTC time can be hard to read, so let KQL do the heavy lifting for you.
We can even visualize the trend of our last sign ins. In this example we look at when our inbound guests last signed in. Inbound guests are those from other tenants connecting to yours. To do this, we summarize our data twice. First we get the last sign in date for each guest. Then we group that data into each month.
SigninLogs
| where TimeGenerated > ago (360d)
| where UserType == "Guest"
| where AADTenantId != HomeTenantId and HomeTenantId != ResourceTenantId
| where ResultType == 0
| summarize arg_max(TimeGenerated, *) by UserPrincipalName
| project TimeGenerated, UserPrincipalName
| summarize ['Count of Last Signin']=count() by startofmonth(TimeGenerated)
| render columnchart with (title="Guest inactivity per month")
Another interesting thing with Azure AD guests is that invites never expire. So once you invite a guest the pending invite will be there forever. You can use KQL to find invites that have been sent but not redeemed.
let timerange=180d;
let timeframe=30d;
AuditLogs
| where TimeGenerated between (ago(timerange) .. ago(timeframe))
| where OperationName == "Invite external user"
| extend GuestUPN = tolower(tostring(TargetResources[0].userPrincipalName))
| summarize arg_max(TimeGenerated, *) by GuestUPN
| project TimeGenerated, GuestUPN
| join kind=leftanti  (
    AuditLogs
    | where TimeGenerated > ago (timerange)
    | where OperationName == "Redeem external user invite"
    | where CorrelationId <> "00000000-0000-0000-0000-000000000000"
    | extend d = tolower(tostring(TargetResources[0].displayName))
    | parse d with * "upn: " GuestUPN "," *
    | project TimeGenerated, GuestUPN)
    on GuestUPN
| project TimeGenerated, GuestUPN, ['Days Since Invite Sent']=datetime_diff("day", now(), TimeGenerated)
For this we join two queries – guest invites and guest redemptions. Then search for when there isn’t a redemption. We then re-use our datetime_diff to work out how many days since the invite was sent. For this query we also exclude invites sent in the last 30 days. Those guests may just not have gotten around to redeeming their invites yet. Once a user has been invited, the user object already exists in your tenant. It just sits there idle until they redeem the invite. If they haven’t accepted the invite in 45 days, then it is probably best to delete the user objects.
Service Principals
The great thing about KQL is once we write a query we like, we can easily re-use it. Service principals are everything in Azure AD. They control what your applications can access. Much like users, we may no longer be using service principals. Perhaps that application has been decommissioned. Maybe the integration that was in use has been retired. Much like users, if they are no longer in use, we should remove them.
Let’s re-use our inactive user query, and this time look for inactive service principals.
AADServicePrincipalSignInLogs
| where TimeGenerated > ago(365d)
| where ResultType == "0"
| summarize arg_max(TimeGenerated, *) by AppId
| project TimeGenerated, ServicePrincipalName, ['Days Since Last Logon']=datetime_diff("day", now(),TimeGenerated)
| where ['Days Since Last Logon'] >= 45 | sort by ['Days Since Last Logon'] desc
Have a look through the list and see which can be deleted.
Service principals can fail to sign in for many reasons, much like regular users. With regular users though we get an easy to read description that can help us out. With service principals, we unfortunately just get an error code. Using the case operator we can add our own friendly descriptions to help us out. We just say, when our result code is this, then provide us an easy to read description.
AADServicePrincipalSignInLogs
| where ResultType != "0"
| extend ErrorDescription = case (
    ResultType == "7000215", strcat("Invalid client secret is provided"),
    ResultType == "7000222", strcat("The provided client secret keys are expired"),
    ResultType == "700027", strcat("Client assertion failed signature validation"),
    ResultType == "700024", strcat("Client assertion is not within its valid time range"),
    ResultType == "70021", strcat("No matching federated identity record found for presented assertion"),
    ResultType == "500011", strcat("The resource principal named {name} was not found in the tenant named {tenant}"),
    ResultType == "700082", strcat("The refresh token has expired due to inactivity"),
    ResultType == "90025", strcat("Request processing has exceeded gateway allowance"),
    ResultType == "500341", strcat("The user account {identifier} has been deleted from the {tenant} directory"),
    ResultType == "100007", strcat("AAD Regional ONLY supports auth either for MSIs OR for requests from MSAL using SN+I for 1P apps or 3P apps in Microsoft infrastructure tenants"),
    ResultType == "1100000", strcat("Non-retryable error has occurred"),
    ResultType == "90033", strcat("A transient error has occurred. Please try again"),
    ResultType == "53003",strcat("Access has been blocked by Conditional Access policies. The access policy does not allow token issuance."),
    "Unknown"
    )
| project TimeGenerated, ServicePrincipalName, ServicePrincipalId, ErrorDescription, ResultType, IPAddress
You may be particularly interested in signins with expired or invalid secrets. Are the service principals still in use? Perhaps you can remove them. Or you may be interested where conditional access blocks a service principal sign-in.
Have the credentials for that service principal leaked? It may be worth investigating and rotating credentials if required.
Enterprise Applications
For applications that have had no sign in activity for a long time that could be a sign of a couple of things. Firstly, you may have retired that application. If that is the case, then you should delete the enterprise application from your tenant.
Secondly, it may mean that people are bypassing SSO to access the application. For example, you may use a product like Confluence. You may have enabled SSO to it, but users still have the ability to sign on using ‘local’ credentials. Maybe users do that because it is more convenient to bypass conditional access. For those applications you know are still in use, but you aren’t seeing any activity you should investigate. If the applications have the ability to prevent the use of local credentials then you should enable that. Perhaps you have the ability to set the password for local accounts, you could set them to something random the users don’t know to enforce SSO.
If those technical controls don’t exist, you may need to try softer controls. You should try get buy in from the application owners or users and explain the risks of local credentials. A good point to highlight is that when a user leaves an organization then their account is disabled. When that happens, they lose access to any SSO enforced applications. In applications that use local credentials the lifecycle of accounts is likely poorly managed. Application owners usually don’t want ex employees still having access to data, so that may help enforce good behaviour.
We can find apps that have had no sign ins in the last 30 days easily.
SigninLogs
| where TimeGenerated > ago (365d)
| where ResultType == 0
| summarize arg_max(TimeGenerated, *) by AppId
| project
    AppDisplayName,
    ['Last Logon Time']=TimeGenerated,
    ['Days Since Last Logon']=datetime_diff("day", now(), TimeGenerated)
| where ['Days Since Last Logon'] > 30 | sort by ['Days Since Last Logon'] desc
Maybe you are interested in application usage more generally. We can bring back some stats for each of your applications. Perhaps you want to see total sign ins to each vs distinct sign ins. Some applications may be very noisy with their sign in data. But when you look at distinct users, they aren’t as busy as you thought.
SigninLogs
| where TimeGenerated > ago(30d)
| where ResultType == 0
| summarize ['Total Signins']=count(), ['Distinct User Signins']=dcount(UserPrincipalName) by AppDisplayName | sort by ['Distinct User Signins'] desc
You may be also interested in the breakdown of guests vs members for each application. Maybe guests are accessing something they aren’t meant to. If you notice that you can put a group in front of that app to control access.
For this query we use the dcountif operator. Which returns a distinct count of a column where something is true. So for this example, we return a distinct user count where the UserType is a member. Then again for guests.
SigninLogs
| where TimeGenerated > ago(30d)
| where ResultType == 0
| summarize ['Distinct Member Signins']=dcountif(UserPrincipalName, UserType == "Member"), ['Distinct Guest Signins']=dcountif(UserPrincipalName, UserType == "Guest")  by AppDisplayName | sort by ['Distinct Guest Signins']
Use your knowledge of your environment to make sense of the results. If you have lots of guests accessing something you didn’t expect, then investigate.
Privileged Access
As always, your privileged users deserve a more scrutiny. You can detect when a user accesses particular Azure applications for the first time. This query looks back 90 days, then detects if a user accesses one of these applications for the first time.
//Detects users who have accessed Azure AD Management interfaces who have not accessed in the previous timeframe
let timeframe = startofday(ago(90d));
let applications = dynamic(["Azure Active Directory PowerShell", "Microsoft Azure PowerShell", "Graph Explorer", "ACOM Azure Website"]);
SigninLogs
| where TimeGenerated > timeframe and TimeGenerated < startofday(now())
| where AppDisplayName in (applications)
| project UserPrincipalName, AppDisplayName
| join kind=rightanti
    (
    SigninLogs
    | where TimeGenerated > startofday(now())
    | where AppDisplayName in (applications)
    )
    on UserPrincipalName, AppDisplayName
| where ResultType == 0
| project TimeGenerated, UserPrincipalName, ResultType, AppDisplayName, IPAddress, Location, UserAgent
You could expand the list to include privileged applications specific to your environment too.
If you use Azure AD Privileged Identity Management (PIM) you can keep an eye on those actions too. For example, we can find users who haven’t elevated to a role for over 30 days. If you have users with privileged roles but they aren’t actively using them then they should be removed. This query also returns you the role which they last activated.
AuditLogs
| where TimeGenerated > ago (365d)
| project TimeGenerated, OperationName, Result, TargetResources, InitiatedBy
| where OperationName == "Add member to role completed (PIM activation)"
| where Result == "success"
| extend ['Last Role Activated'] = tostring(TargetResources[0].displayName)
| extend Actor = tostring(parse_json(tostring(InitiatedBy.user)).userPrincipalName)
| summarize arg_max(TimeGenerated, *) by Actor
| project Actor, ['Last Role Activated'], ['Last Activation Time']=TimeGenerated, ['Days Since Last Activation']=datetime_diff("day", now(), TimeGenerated)
| where ['Days Since Last Activation'] >= 30
| sort by ['Days Since Last Activation'] desc
One of the biggest strengths of KQL is manipulating time. We can use that capability to add some logic to our queries. For example, we can find PIM elevation events that are outside of business hours.
let timerange=30d;
AuditLogs
// extend LocalTime to your time zone
| extend LocalTime=TimeGenerated + 5h
| where LocalTime > ago(timerange)
// Change hours of the day to suit your company, i.e this would find activations between 6pm and 6am
| where hourofday(LocalTime) !between (6 .. 18)
| where OperationName == "Add member to role completed (PIM activation)"
| extend RoleName = tostring(TargetResources[0].displayName)
| project LocalTime, OperationName, Identity, RoleName, ActivationReason=ResultReason
If this is unexpected behaviour for you then it’s worth looking at. Maybe an account has been compromised. Or it could be a sign of malicious insider activity from your admins.
MFA & Passwordless
In a perfect world we would have MFA on everything. That may not be the reality in your tenant. In fact, it’s not the reality in many tenants. For whatever reason your MFA coverage may be patchy. You could be on a roadmap to deploying it, or trying to onboard applications to SSO.
Our sign on logs provide great insight to single factor vs multi factor connections. We can summarize and visualize that data in different ways to track your MFA progress. If you want to just look across your tenant as a whole we can do that of course.
SigninLogs
| where TimeGenerated > ago (30d)
| summarize ['Single Factor Authentication']=countif(AuthenticationRequirement == "singleFactorAuthentication"), ['Multi Factor Authentication']=countif(AuthenticationRequirement == "multiFactorAuthentication") by bin(TimeGenerated, 1d)
| render timechart with (ytitle="Count", title="Single vs Multifactor Authentication last 30 days")
There is some work to be done in the demo tenant!
You can even build a table out of all your applications. From that we can count the percentage of sign ins that are covered by MFA. This may give you some direction to enabling MFA.
let timerange=30d;
SigninLogs
| where TimeGenerated > ago(timerange)
| where ResultType == 0
| summarize
    TotalCount=count(),
    MFACount=countif(AuthenticationRequirement == "multiFactorAuthentication"),
    nonMFACount=countif(AuthenticationRequirement == "singleFactorAuthentication")
    by AppDisplayName
| project AppDisplayName, TotalCount, MFACount, nonMFACount, MFAPercentage=(todouble(MFACount) * 100 / todouble(TotalCount))
| sort by MFAPercentage desc
If that much data is too overwhelming, why not start with your most popular applications? Here we use the same logic, but first calculate our top 20 applications.
let top20apps=
    SigninLogs
    | where TimeGenerated > ago (30d)
    | summarize UserCount=dcount(UserPrincipalName)by AppDisplayName
    | sort by UserCount desc
    | take 20
    | project AppDisplayName;
//Use that list to calculate the percentage of signins to those apps that are covered by MFA
SigninLogs
| where TimeGenerated > ago (30d)
| where AppDisplayName in (top20apps)
| summarize TotalCount=count(),
    MFACount=countif(AuthenticationRequirement == "multiFactorAuthentication"),
    nonMFACount=countif(AuthenticationRequirement == "singleFactorAuthentication")
    by AppDisplayName
| project AppDisplayName, TotalCount, MFACount, nonMFACount, MFAPercentage=(todouble(MFACount) * 100 / todouble(TotalCount))
| sort by MFAPercentage asc
Passwordless technology has been around for a little while now, but it is only starting now to hit mainstream. Azure AD provides lots of different options. FIDO2 keys, Windows Hello for Business, phone sign in etc. You can track password vs passwordless sign ins to your tenant.
let timerange=180d;
SigninLogs
| project TimeGenerated, AuthenticationDetails
| where TimeGenerated > ago (timerange)
| extend AuthMethod = tostring(parse_json(AuthenticationDetails)[0].authenticationMethod)
| where AuthMethod != "Previously satisfied"
| summarize
    Password=countif(AuthMethod == "Password"),
    Passwordless=countif(AuthMethod in ("FIDO2 security key", "Passwordless phone sign-in", "Windows Hello for Business", "Mobile app notification","X.509 Certificate"))
    by startofweek(TimeGenerated)
| render timechart  with ( xtitle="Week", ytitle="Signin Count", title="Password vs Passwordless signins per week")
Passwordless needs a little more love in the demo tenant for sure!
You could even go one better, and track each type of passwordless technology. Then you can see what is the most favored.
let timerange=180d;
SigninLogs
| project TimeGenerated, AuthenticationDetails
| where TimeGenerated > ago (timerange)
| extend AuthMethod = tostring(parse_json(AuthenticationDetails)[0].authenticationMethod)
| where AuthMethod in ("FIDO2 security key", "Passwordless phone sign-in", "Windows Hello for Business", "Mobile app notification","X.509 Certificate")
| summarize ['Passwordless Method']=count()by AuthMethod, startofweek(TimeGenerated)
| render timechart with ( xtitle="Week", ytitle="Signin Count", title="Passwordless methods per week")
Legacy Authentication
There is no better managed Azure AD tenant than one where legacy auth is completely disabled. Legacy auth is a security issue because it isn’t MFA aware. If one of your users are compromised, they could bypass MFA policies by using legacy clients such as IMAP or ActiveSync. The only conditional access rules that work for legacy auth are allow or block. Because conditional access defaults to allow, unless you explicitly block legacy auth, those connections will be allowed.
Microsoft are looking to retire legacy auth in Exchange Online on October 1st, 2022 which is fantastic. However, legacy auth can be used for non Exchange Online workloads. We can use our sign in log data to track exactly where legacy auth is used. That way we can not only be ready for October 1, but maybe we can retire it from our tenant way before then. Win win!
The Azure AD sign in logs contain useful information about what app is being used during a legacy sign in. Let’s start there and look at all the various legacy client apps. We can also retrieve the users for each.
SigninLogs
| where TimeGenerated > ago(30d)
| where ResultType == 0
| where ClientAppUsed in ("Exchange ActiveSync", "Exchange Web Services", "AutoDiscover", "Unknown", "POP3", "IMAP4", "Other clients", "Authenticated SMTP", "MAPI Over HTTP", "Offline Address Book")
| summarize ['Count of legacy auth attempts'] = count()by ClientAppUsed, UserPrincipalName
| sort by ClientAppUsed asc, ['Count of legacy auth attempts'] desc
This will show us each client app, such as IMAP or Activesync. For each app it lists the most active users for each. That will give you good direction to start migrating users and applications to modern auth.
If you want to visualize how you are going with disabling legacy auth, we can do that too. We can even compare that to how many legacy auth connections are blocked.
SigninLogs
| where TimeGenerated > ago(180d)
| where ResultType in ("0", "53003")
| where ClientAppUsed in ("Exchange ActiveSync", "Exchange Web Services", "AutoDiscover", "Unknown", "POP3", "IMAP4", "Other clients", "Authenticated SMTP", "MAPI Over HTTP", "Offline Address Book")
| summarize
    ['Legacy Auth Users Allowed']=dcountif(UserPrincipalName, ResultType == 0),
    ['Legacy Auth Users Blocked']=dcountif(UserPrincipalName, ResultType == 53003)
    by bin(TimeGenerated, 1d)
| render timechart with (ytitle="Count",title="Legacy auth distinct users allowed vs blocked by Conditional Access")
Hopefully your allowed connections are on the decrease.
You may be wondering why blocks aren’t increasing at the same time. That is easily explained. For instance, say you migrate from Activesync to using the Outlook app on your phone. Once you make that change, there simply won’t be legacy auth connection to block anymore. Visualizing the blocks however provides a nice baseline. If you see a sudden spike, then something out there is still trying to connect and you should investigate.
Conditional Access
Azure AD conditional access is key to security for your Azure AD tenant. It decides who is allowed in, or isn’t. It also defines the rules people must follow to be allowed in. For instance, requiring multi factor authentication. Azure AD conditional access evaluates every sign into your tenant, and decides if they are approved to enter. The detail for conditional access evaluation is held within every sign in event. If we look at a sign in event from the demo environment, we can see what this data looks like.
So Azure AD evaluated this sign in. It determined the policy ‘MeganB MCAS Proxy’ was in scope for this sign in. So then it enforced the sign in to go through Defender for Cloud Apps (previously Cloud App Security). You can imagine if you have lots of policies, and lots of sign ins, this is a huge amount of data. We can summarize this data in lots of ways. Like any security control, we should regularly review to confirm that control is in use. We can find any policies that have had either no success events (user allowed in). And also no failure events (user blocked).
SigninLogs
| where TimeGenerated > ago (30d)
| project TimeGenerated, ConditionalAccessPolicies
| mv-expand ConditionalAccessPolicies
| extend CAResult = tostring(ConditionalAccessPolicies.result)
| extend CAPolicyName = tostring(ConditionalAccessPolicies.displayName)
| summarize CAResults=make_set(CAResult) by CAPolicyName
| where CAResults !has "success" and CAResults !has "failure"
In this test tenant we can see some policies that we have a hit on.
Some of these policies are not enabled. Some are in report only mode. Or they are simply not applying to any sign ins. You should review this list to make sure it is what you expect. If you are seeing lots of ‘notApplied’ results, make sure you have configured your policies properly.
If you wanted to focus on conditional access failures specifically, you can do that too. This query will find any policy with failures, then return the reason for the failure. This can be simply informational for you to show they are working as intended. Or if you are getting excessive failures maybe your policy needs tuning.
You could visualize the same failures if you wanted to look at any trends or spikes.
let start = now(-90d);
let end = now();
let timeframe= 12h;
SigninLogs
| project TimeGenerated, ResultType, ConditionalAccessPolicies
| where ResultType == 53003
| extend FailedPolicy = tostring(ConditionalAccessPolicies[0].displayName)
| make-series FailureCount = count() default=0 on TimeGenerated in range(start,end, timeframe) by FailedPolicy
| render timechart
Summary
I have provided you with a few examples of different queries to help manage your tenant. KQL gives you the power to manipulate your data in so many ways. Have a think about what is important to you. You can then hopefully use the above examples as a starting point to find what you need.
If you are licensed for the Microsoft provided tools then definitely use them. However if there are gaps, don’t be scared of looking at the data yourself. KQL is powerful and easy to use.
There are also a number of provided workbooks in your Azure AD tenant you can use too. You can find them under ‘workbooks’ in Azure AD. They cover some queries similar to this, and plenty more.
You need to combine the Microsoft tools and your own knowledge to effectively manage your directory.
The InfoSec community is amazing at providing insight into ransomware and malware attacks. There are so many fantastic contributors who share indicators of compromise (IOCs) and all kinds of other data. Community members and vendors publish detailed articles on various attacks that have occurred.
Usually these reports contain two different things. Indicators of compromise (IOCs) and tactics, techniques and procedures (TTPs). What is the difference?
Indicators of compromise – are some kind of evidence that an attack has occurred. This could be a malicious IP address or domain. It could be hashes of files. These indicators are often shared throughout the community. You can hunt for IOCs on places like Virus Total.
Tactics, techniques and procedures – describe the behaviour of how an attack occurred. These read more like a story of the attack. They are the ‘why’, the ‘what’ and the ‘how’ of an attack. Initial access was via phishing. Then reconnaissance. Then execution was via exploiting a scheduled task on a machine. These are also known as attack or kill chains. The idea being if you detected the attack earlier in the chain, the damage could have been prevented.
Using a threat intelligence source which provides IOCs is a key part to sound defence. If you detect known malicious files or domains in your environment then you need to react. There is, however, a delay between an attack occurring and these IOCs being available. Due to privacy, or legal requirements or dozens of other reasons, some IOCs may never be public. Also they can change. New malicious domains or IPs can come online. File hashes can change. That doesn’t make IOCs any less valuable. IOCs are still crucial and important in detection.
We just need to pair our IOC detection with TTP/kill chain detection to increase our defence. These kind of detections look for behaviour rather than specific IOCs. We want to try and detect suspicious activities, so that we can be alerted on potential attacks with no known IOCs. Hopefully these detections also occur earlier in the attack timeline and we are alerted before damage is done.
If we take for example the Trojan.Killdisk / HermeticWiper malware that has recently been documented. There are a couple of great write ups about the attack timeline. Symantec released this post which provides great insight. And Senior Microsoft Security Researcher Thomas Roccia (who you should absolutely follow) put together this really useful infographic. It visualizes the progression of the attack in a way that is easy to understand and follow. This visualizes both indicators and TTPs.
This article won’t focus on IOC detection, there are so many great resources for that. Instead we will work through the infographic and Symantec attack chain post. For each step in the chain, we will try to come up with a behavioural detection. Not one that focuses on any specific IOC, but to catch the activity itself. Using event logs and data taken from Microsoft Defender for Endpoint, we can generate some valuable alert rules.
From Thomas’ infographic we can see some early reconnaissance and defence evasion.
The attacker enumerated which privileges the account had. We can find these events with.
DeviceProcessEvents
| where FileName == "whoami.exe" and ProcessCommandLine contains "priv"
| project TimeGenerated, DeviceName, InitiatingProcessAccountName, FileName, InitiatingProcessCommandLine, ProcessCommandLine
We get a hit for someone looking at the privilege of the logged on account. This activity should not be occurring often in your environment outside of security staff.
The attacker then disabled the volume shadow copy service (VSS), to prevent restoration. When services are disabled they trigger Event ID 7040 in your system logs.
This query searches for the specific service disabled in this case. You could easily exclude the ‘ServiceName == “Volume Shadow Copy”‘ section. This would return you all services disabled. This may be an unusual event in your environment you wish to know about.
If we switch over to the Symantec article we can continue the timeline. So post compromise of a vulnerable Exchange server, the first activity noted is.
The decoded PowerShell was used to download a JPEG file from an internal server, on the victim’s network.
The article states they have decoded the PowerShell to make it readable for us. Which means it was encoded during the attack. Maybe our first rule could be searching for PowerShell that has been encoded? We can achieve that. Start with a broad query. Look for PowerShell and anything with an -enc or -encodedcommand switch.
DeviceProcessEvents
| where ProcessCommandLine contains "powershell" or InitiatingProcessCommandLine contains "powershell"
| where ProcessCommandLine contains "-enc" or ProcessCommandLine contains "-encodedcommand" or InitiatingProcessCommandLine contains "-enc" or InitiatingProcessCommandLine contains "-encodedcommand"
If you wanted to use some more advanced operators, we could extract the encoded string. Then attempt to decode it within our query. Query modified from this post.
DeviceProcessEvents
| where ProcessCommandLine contains "powershell" or InitiatingProcessCommandLine contains "powershell"
| where ProcessCommandLine contains "-enc" or ProcessCommandLine contains "-encodedcommand" or InitiatingProcessCommandLine contains "-enc" or InitiatingProcessCommandLine contains "-encodedcommand"
| extend EncodedCommand = extract(@'\s+([A-Za-z0-9+/]{20}\S+$)', 1, ProcessCommandLine)
| where EncodedCommand != ""
| extend DecodedCommand = base64_decode_tostring(EncodedCommand)
| where DecodedCommand != ""
| project TimeGenerated, DeviceName, InitiatingProcessAccountName, InitiatingProcessCommandLine, ProcessCommandLine, EncodedCommand, DecodedCommand
We can see a result where I encoded a PowerShell command to create a local account on this device.
We use regex to extract the encoded string. Then we use the base64_decode_tostring operator to decode it for us. This second query only returns results when the string can be decoded. So have a look at both queries and see the results in your environment.
This is a great example of hunting IOCs vs TTPs. We aren’t hunting for specific PowerShell commands. We are hunting for the behaviour of encoded PowerShell.
The next step was –
A minute later, the attackers created a scheduled task to execute a suspicious ‘postgresql.exe’ file, weekly on a Wednesday, specifically at 11:05 local-time. The attackers then ran this scheduled task to execute the task.
Attackers may lack privilege to launch an executable under system. They may have privilege to update or create a scheduled task running under a different user context. They could change it from a non malicious to malicious executable. In this example they have created a scheduled task with a malicious executable. Scheduled task creation is a specific event in Defender, so we can track those. We can also track changes and deletions of scheduled tasks.
There is a good chance you get significant false positives with this query. If you read on we will try to tackle that at the end.
Following from the scheduled task creation and execution, Symantec notes that next –
Beginning on February 22, Symantec observed the file ‘postgresql.exe’ being executed and used to perform the following
Execute certutil to check connectivity to trustsecpro[.]com and whatismyip[.]com Execute a PowerShell command to download another JPEG file from a compromised web server – confluence[.]novus[.]ua
So the attackers leveraged certutil.exe to check internet connectivity. Certutil can be used to do this, and even download files. We can use our DeviceNetworkEvents table to find this kind of event.
We search for DeviceNetworkEvents where the initiating process command line includes certutil. We can also filter on only connections where the Remote IP is public if you have legitimate internal use.
We can see where I used certutil to download GhostPack from GitHub. I even attempted to obfuscate the command line, but we still found it. This is another great example of searching for TTPs. We don’t hunt for certutil.exe connecting to a specific IOC, but anytime it connects to the internet.
The next activity was credential dumping –
Following this activity, PowerShell was used to dump credentials from the compromised machine
There are many ways to dump credentials from a machine, many are outlined here. We can detect on procdump usage or comsvcs.dll exploitation. For comsvcs –
We can see as part of the running these scripts, the execution policy was changed. PowerShell execution bypass activity can be found easily enough.
DeviceProcessEvents
| where TimeGenerated > ago(1h)
| project InitiatingProcessAccountName, InitiatingProcessCommandLine
| where InitiatingProcessCommandLine has_all ("powershell","bypass")
This is another one that is going to be high volume. Let’s try and tackle that now.
With any queries that are relying on behaviour there is a chance for false positives. With false positives comes alert fatigue. We don’t want a legitimate alert buried in a mountain of noise. Hopefully the above queries don’t have any false positives in your environment. Unfortunately, that is not likely to be true. The nature of these attack techniques is they leverage tools that are used legitimately. We can try to tune these alerts down by whitelisting particular servers or commands. We don’t want to whitelist the server that is compromised.
Instead, we could look at adding some more intelligence to our queries. To do that we can try to add a baseline to our environment. Then we alert when something new occurs.
We build these types of queries by using an anti join in KQL. Anti joins can be a little confusing, so let’s try to visualize them from a security point of view.
First, think of a regular (or inner) join in KQL. We take two queries or tables and join them together on a field (or fields) that exist in both tables. Maybe you have firewall data and Active Directory data. Both have IP address information so you can join them together. Have a read here for an introduction to inner joins. We can visualize an inner join like this.
So for a regular (or inner) join, we write two queries, then match them on something that is the same in both. Maybe an IP address, or a username. Once we join we can retrieve information back from both tables.
When we expand on this, we can do anti-joins. Let’s visualize a leftanti join.
So we can again write two queries, join them on a matching field. But this time, we only return data from the first (left) query. A rightanti join is the opposite.
For rightanti joins we run our two queries. We match on our data. But this time we only return results that exist in the second (or right) query.
With joins in KQL, you don’t need to join between two different data sets. Which can be confusing to grasp. You can join between the same table, with different query options. So we can query the DeviceEvent table for one set of data. Query the DeviceEvent table again, with different parameters. Then join them in different ways. When joining the same table together I think of it like this –
Use a leftanti join when you want to detect when something stops happening.
Use a rightanti join when you want to detect when something happens for the first time.
Now let’s see how we apply these joins to our detection rules.
Scheduled task creation is a good one to use as an example. Chances are you have legitimate software on your devices that create tasks. We will use our rightanti join to add some intelligence to our query.
Let’s look at the following query.
DeviceEvents
| where TimeGenerated > ago(30d) and TimeGenerated < ago(1h)
| where ActionType == "ScheduledTaskCreated"
| extend ScheduledTaskName = tostring(AdditionalFields.TaskName)
| distinct ScheduledTaskName
| join kind=rightanti
    (DeviceEvents
    | where TimeGenerated > ago(1h)
    | where ActionType == "ScheduledTaskCreated"
    | extend ScheduledTaskName = tostring(AdditionalFields.TaskName)
    | project TimeGenerated, DeviceName, ScheduledTaskName, InitiatingProcessAccountName)
    on ScheduledTaskName
| project TimeGenerated, DeviceName, InitiatingProcessAccountName, ScheduledTaskName
Our first (or left) query looks at our DeviceEvents. We go back between 30 days ago and one hour ago. From that data, all we care about are the names of all the scheduled tasks that have been created. So we use the distinct operator. That first query becomes our baseline for our environment.
Next we select our join type. Kind = rightanti. We join back to the same table, DeviceEvents. This time though, we are only interested in the last hour of data. We retrieve the TimeGenerated, DeviceName, InitiatingProcessAccountName and ScheduledTaskName.
Then we tell KQL what field we want to join on. We want to join on ScheduledTaskName. Then return only data that is new in the last hour.
So to recap. First find all the scheduled tasks created between 30 days and an hour ago. Then find me all the scheduled tasks created in the last hour. Finally, only retrieve tasks that are new to our environment in the last hour. That is how we do a rightanti join.
Another example is PowerShell commands that change the execution policy to bypass. You probably see plenty of these in your environment
DeviceProcessEvents
| where TimeGenerated > ago(30d) and TimeGenerated < ago(1h)
| project InitiatingProcessAccountName, InitiatingProcessCommandLine
| where InitiatingProcessCommandLine has_all ("powershell","bypass")
| distinct InitiatingProcessAccountName, InitiatingProcessCommandLine
| join kind=rightanti  (
    DeviceProcessEvents
    | where TimeGenerated > ago(1h)
    | project
        TimeGenerated,
        DeviceName,
        InitiatingProcessAccountName,
        InitiatingProcessCommandLine
    | where InitiatingProcessAccountName !in ("system","local service","network service")
    | where InitiatingProcessCommandLine has_all ("powershell","bypass")
    )
    on InitiatingProcessAccountName, InitiatingProcessCommandLine
This query is nearly the same as the one previous. We look back between 30 days and one hour. This time we query for commands executed that contain both ‘powershell’ and ‘bypass’. This time we retrieve both distinct commands and the account that executed them.
Then choose our rightanti join again. Run the same query once more for the last hour. We join on both our fields. Then return what is new to our environment in the last hour. For this query, the combination of command line and account needs to be unique.
For this particular example I excluded processes initiated by system, local service or network service. This will find events run under named user accounts only. This is an example though and it is easy enough to include all commands.
In summary.
These queries aren’t meant to be perfect hunting queries for all malware attack paths. They may definitely useful detections in your environment though. The idea is to try to help you think about TTP detections.
When you read malware and ransomware reports you should look at both IOCs and TTPs.
Detect on the IOCs. If you use Sentinel you can use Microsoft provided threat intelligence. You can also include your own feeds. Information is available here. There are many ready to go rules to leverage that data you can simply enable.
For TTPs, have a read of the report and try to come up with queries that detect that behaviour. Then have a look how common that activity is for you. The example above of using certutil.exe to download files is a good example. That may be extremely rare in your environment. Your hunting query doesn’t need to list the specific IOCs to that action. You can just alert any time certutil.exe connects to the internet.
Tools like PowerShell are used both maliciously and legitimately. Try to write queries that detect changes or anomalies in those events. Apply your knowledge of your environment to try and filter the noise without filtering out genuine alerts.
All the queries in this post that use Device* tables should also work in Advanced Hunting. You will just need to change ‘timegenerated’ to ‘timestamp’.
Defenders are often looking for a single event within their logs. Evidence of malware or a user clicking on a phishing link? Whatever it may be. Sometimes though you may be looking for a series of events, or perhaps trends in your data. Maybe a quick increase in a certain type of activity. Or several actions within a specific period. Take for example RDP connections. Maybe a user connecting to a single device via RDP doesn’t bother you. What if they connect to 5 different ones in the space of 15 minutes though? That is more likely cause for concern.
If you send a lot of data to Sentinel, or even use Microsoft 365 Advanced Hunting, you will end up with a lot of information to work with. Thankfully, KQL is amazing at data summation. There is actually a whole section of the official documentation devoted to aggregation. Looking at the list it can be pretty daunting though.
The great thing about aggregation with KQL in Log Analytics is that you can re-apply the same logic over and over. Once you learn the building blocks, they apply to nearly every data set you have.
So let’s take some examples and work through what they do for us. To keep things simple, we will use the SecurityAlert table for all our examples. This is the table that Microsoft security products write alerts to. It is also a free table!
count() and dcount()
As you would expect count() and dcount() (distinct count) can count for you. Let’s start simple. Our first query looks at our SecurityAlert table over the last 24 hours. We create a new column called AlertCount with the total. Easy.
SecurityAlert
| where TimeGenerated > ago(24h)
| summarize AlertCount=count()
To build on that, you can count by a particular column within the table. We do that by telling KQL to count ‘by’ the AlertName.
SecurityAlert
| where TimeGenerated > ago(24h)
| summarize AlertCount=count() by AlertName
This time we are returned a count of each different alert we have had in the last 24 hours.
You can count many columns at the same time, by separating them with a comma. So we can add the ProductName into our query.
SecurityAlert
| where TimeGenerated > ago(24h)
| summarize AlertCount=count() by AlertName, ProductName
We get the same AlertCount, but also the product that generated the alert.
For counting distinct values we use dcount(). Again, start simply. Let’s count all the distinct alerts in the last 24 hours.
SecurityAlert
| where TimeGenerated > ago(24h)
| summarize DistinctAlerts=dcount(AlertName)
So in our very first query we had 203 total alerts. By using dcount, we can see we only have 41 distinct alert names. That is normal, you will be getting multiples of a lot of alerts.
We can include ProductName into a dcount query too.
SecurityAlert
| where TimeGenerated > ago(24h)
| summarize DistinctAlerts=dcount(AlertName) by ProductName
We are returned the distinct alerts by each product.
To build on both of these further, we can also count or dcount based on a time period. For example you may be interested in the same queries, but broken down by day.
SecurityAlert
| where TimeGenerated > ago(7d)
| summarize AlertCount=count() by bin(TimeGenerated, 1d)
So let’s change our very first query. First, we look back 7 days instead of 1. Then we will put our results into ‘bins’ of 1 day. To do that we add ‘by bin(TimeGenerated, 1d)’. We are saying, return 7 days of data, but put it into groups of 1 day.
If we include our AlertName, we can still do the same.
SecurityAlert
| where TimeGenerated > ago(7d)
| summarize AlertCount=count() by AlertName, bin(TimeGenerated, 1d)
We see our different alerts placed into 1 day time periods. Of course, we can do the same for dcount.
SecurityAlert
| where TimeGenerated > ago(7d)
| summarize AlertCount=dcount(AlertName) by bin(TimeGenerated, 1d)
Our query returns distinct alert names per 1 day blocks.
countif() and dcountif()
The next natural step is to look at countif() and dcountif(). The guidance for these states “Returns a count with the predicate of the group”. Well, what does that mean? It’s more simple that it seems. It means that it will return a count or dcount when something is true. Let’s use our same SecurityAlert table.
In this query, we look for all Security Alerts in the last 24 hours. But we want to only count them when they are high severity. So we include a countif statement.
When we ran this query originally we had 203 results. But filtering for high severity alerts, we drop down to 17. You can include multiple arguments to your query.
SecurityAlert
| where TimeGenerated > ago(1d)
| summarize HighSeverityAlerts=countif(AlertSeverity == "High" and ProductName == "Azure Active Directory Identity Protection")
This includes only high severity alerts generated by Azure AD Identity Protection. You can countif multiple items in the same query too.
This query returns two counts. One for high severity alerts and the second for anything generated by MS ATP. You can break these down into time periods too, like a standard count. Using the same logic as earlier.
SecurityAlert
| where TimeGenerated > ago(7d)
| summarize HighSeverityAlerts=countif(AlertSeverity == "High") by bin(TimeGenerated, 1d)
We see high severity alerts per day over the last week.
dcountif works exactly as you would expect too. It returns a distinct count where the statement is true.
This will return distinct count of alert names where the alert severity is high. And once again, by time bucket.
SecurityAlert
| where TimeGenerated > ago(7d)
| summarize DistinctAlerts=dcountif(AlertName, AlertSeverity == "High") by bin(TimeGenerated, 1d)
arg_max() and arg_min()
arg_max and arg_min are a couple of very simple but powerful functions. They return the extremes of your query. Let’s use our same example query to show you what I mean.
SecurityAlert
| where TimeGenerated > ago(1d)
| summarize arg_max(TimeGenerated, *)
If you run this query, you will be returned a single row. It will be the latest alert to trigger. If you had 500 alerts in the last day, it will still only return the latest.
arg_max tells us to retrieve the maximum value. In the brackets we select TimeGenerated as the field we want to maximize. Then our * indicates return all the data for that row. If we switch it to arg_min, we would get the oldest record.
We can use arg_max and arg_min against particular columns.
SecurityAlert
| where TimeGenerated > ago(1d)
| summarize arg_max(TimeGenerated, *) by AlertName
This time we will be returned a row for each alert name. We tell KQL to bring back the latest record by Alert. So if you had the same alert trigger 5 times, you would just get the latest record.
These are a couple of really useful functions. You can use it to calculate when certain things last happened. If you look up sign in data and use arg_max, you can see when a user last signed in. Of if you were querying device network information. Querying the latest record would return you the most up to date information.
You can use your time buckets with these functions too.
SecurityAlert
| where TimeGenerated > ago(30d)
| summarize arg_max(TimeGenerated, *) by AlertName, bin(TimeGenerated, 7d)
With this query we look back 30 days. Then for each 7 day period, we return the latest record of each alert name.
make_list() and make_set()
make_list does basically what you would think it does, it makes a list of data you choose. We can make a list of all our alert names.
SecurityAlert
| where TimeGenerated > ago(1d)
| summarize AlertList=make_list(AlertName)
What is the difference between make list and make set? Make set will only return distinct values of your query. So in the above screenshot you see ‘Unfamiliar sign-in properties’ twice. If you run –
SecurityAlert
| where TimeGenerated > ago(1d)
| summarize AlertList=make_set(AlertName)
Then each alert name would only appear once.
Much like our other aggregation functions, we can build lists and sets by another field.
SecurityAlert
| where TimeGenerated > ago(1d)
| summarize AlertList=make_list(AlertName) by AlertSeverity
This time we have a list of alert names by their severity.
Using make_set in the same query would return distinct alert names per severity. It won’t shock you if you are still reading to know that we can make lists and sets per time period too.
SecurityAlert
| where TimeGenerated > ago(7d)
| summarize AlertList=make_set(AlertName) by bin(TimeGenerated, 1d)
This query gives us a list of alert names per day over the last 7 days. And the same to make a set.
SecurityAlert
| where TimeGenerated > ago(7d)
| summarize AlertList=make_set(AlertName) by AlertSeverity, bin(TimeGenerated, 1d)
make_list_if() and make_set_if()
make_list_if() and make_list_if() are the natural next step to this. They create lists or sets based on a statement being true.
This supports multiple parameters and using time blocks too of course.
SecurityAlert
| where TimeGenerated > ago(7d)
| summarize AlertList=make_set_if(AlertName,AlertSeverity == "Medium" and ProductName == "Microsoft Defender Advanced Threat Protection") by bin(TimeGenerated, 1d)
This query creates a set of alert names for us per day. But it only returns results where the severity is medium and the alert is from MS ATP.
Visualizing your aggregations
Now the really great next step. Once you have summarized your data you can very easily build really great visualizations with it. First, lets summarize our alerts by their severity
SecurityAlert
| where TimeGenerated > ago(1d)
| summarize Alerts=count()by AlertSeverity
Easy, that returns us a summarized set of data.
Now to visualize that in a piechart, we just add one simple line.
KQL will try and guess axis titles and things for you, but you can adjust them yourself. This time we unstack our columns, and rename the axis and title.
SecurityAlert
| where TimeGenerated > ago(7d)
| summarize Alerts=count()by AlertSeverity, bin(TimeGenerated, 1d)
| render columnchart with (kind=unstacked, xtitle="Day", ytitle="Alert Count", title="Alert severity per day")
Aggregation Examples
Interested in aggregating different types of data? A couple are listed below.
This example looks for potential RDP reconnaissance activity.
DeviceNetworkEvents
| where TimeGenerated > ago(7d)
| where ActionType == "ConnectionSuccess"
| where RemotePort == "3389"
// Exclude Defender for Identity which uses RDP to map your network
| where InitiatingProcessFileName <> "Microsoft.Tri.Sensor.exe"
| summarize RDPConnections=make_set(RemoteIP) by bin(TimeGenerated, 20m), DeviceName
| where array_length(RDPConnections) >= 10
We can break this query down by applying what we have learned. First we write our query to look for the data we are interested in. In this case, we look at 7 days of data for successful connections on port 3389. Then we use one of our summarize functions. We make a set of the remote IP addresses each device is connecting to, and place that data into 20 minute bins. We know that each remote IP addresses will be distinct, because we made a set, not a list. Then we look for devices that have connected to 10 or more IP’s in a 20 minute period.
Have you started your passwordless journey? You can visualize your journey using data aggregation.
SigninLogs
| project TimeGenerated, AuthenticationDetails
| where TimeGenerated > ago (90d)
| extend AuthMethod = tostring(parse_json(AuthenticationDetails)[0].authenticationMethod)
| where AuthMethod != "Previously satisfied"
| summarize
    Password=countif(AuthMethod == "Password"),
    Passwordless=countif(AuthMethod in ("FIDO2 security key", "Passwordless phone sign-in", "Windows Hello for Business"))
    by bin(TimeGenerated, 7d)
| render columnchart
    with (
    kind=unstacked,
    xtitle="Week",
    ytitle="Signin Count",
    title="Password vs Passwordless signins per week")
We look back at the last 90 days of Azure AD sign in data. Then use our countif() operator to split out password vs passwordless logins. Then we put that into 7 day buckets, so you can see the trend. Finally, build a nice visualization to present to your boss to ask for money to deploy passwordless. Easy.