
This article is presented as part of the #AzureSpringClean event. The idea of #AzureSpringClean is to promote well managed Azure environments. This article will focus on Azure Active Directory and how we can leverage KQL to keep things neat and tidy.

Much like on premise Active Directory, Azure Active Directory has a tendency to grow quickly. You have new users or guests being onboarded all the time. You are configuring single sign on to apps. You may create service principals for all kinds of integration. And again, much like on premise Active Directory, it is in our best interest to keep on top of all these objects. If users have left the business, or we have decommissioned applications then we also want to clean up all those artefacts.
Microsoft provide tools to help automate some of these tasks – entitlement management and access reviews. Entitlement management lets you manage identity and access at scale. You can build access packages. These access packages can contain all the access a particular role needs. You then overlay just in time access and approval workflows on top.
Access reviews are pretty self explanatory. They let you easily manage group memberships, application and role access. You can schedule access reviews to make sure people only keep the appropriate access.
So if Microsoft provide these tools, why should we dig into the data ourselves? Good question. You may not be licensed for them to start with, they are both Azure AD P2 features. You also may have use cases that fall outside of the capability of those products. Using KQL and the raw data, we can find all kinds of trends in our Azure AD tenant.
First things first though, we will need that data in a workspace! You can choose which Log Analytics workspace from the Azure Active Directory -> Diagnostics setting tab. If you use Microsoft Sentinel, you can achieve the same via the Azure Active Directory data connector.

You can pick and choose what you like. This article is going to cover these three items –
- SignInLogs – all your normal sign ins to Azure AD.
- AuditLogs – all the administrative activities in your tenant, like guest invites and redemptions.
- ServicePrincipalSignInLogs – sign ins for your Service Principals.
Two things to note, you need to be Azure AD P1 to export this data and there are Log Analytics ingestion costs.
Let’s look at seven areas of Azure Active Directory –
- Users and Guests
- Service Principals
- Enterprise Applications
- Privileged Access
- MFA and Passwordless
- Legacy Auth
- Conditional Access
And for each, write some example queries looking for interesting trends. Hopefully in your tenant they can provide some useful information. The more historical data you have the more useful your trends will be of course. But even just having a few weeks worth of data is valuable.
To make things even easier, for most of these queries I have used the Log Analytics demo environment. You may not yet have a workspace of your own, but you still want to test the queries out. The demo environment is free to use for anyone. Some of the data types aren’t available in there, but I have tried to use it as much as possible.
You can access the demo tenant here. You just need to login with any Microsoft account – personal or work, and away you go.
Users and Guests
User lifecycle management can be hard work! Using Azure AD guests can add to that complexity. Guests likely work for other companies or partners. You don’t manage them fully in the way you would your own staff.
Let’s start by finding when our users last signed in. Maybe you want to know when users haven’t signed in for more than 45 days. We can even retrieve our user type at the same time. You could start by disabling these accounts.
SigninLogs
| where TimeGenerated > ago(365d)
| where ResultType == "0"
| summarize arg_max(TimeGenerated, *) by UserPrincipalName
| project TimeGenerated, UserPrincipalName, UserType, ['Days Since Last Logon']=datetime_diff("day", now(),TimeGenerated)
| where ['Days Since Last Logon'] >= 45 | sort by ['Days Since Last Logon'] desc 
We use a really useful operator in this query called datetime_diff. It lets us calculate the time between two events in a way that is easier for us to read. So in this example, we calculate the difference between the last sign in and now in days. UTC time can be hard to read, so let KQL do the heavy lifting for you.
We can even visualize the trend of our last sign ins. In this example we look at when our inbound guests last signed in. Inbound guests are those from other tenants connecting to yours. To do this, we summarize our data twice. First we get the last sign in date for each guest. Then we group that data into each month.
SigninLogs
| where TimeGenerated > ago (360d)
| where UserType == "Guest"
| where AADTenantId != HomeTenantId and HomeTenantId != ResourceTenantId
| where ResultType == 0
| summarize arg_max(TimeGenerated, *) by UserPrincipalName
| project TimeGenerated, UserPrincipalName
| summarize ['Count of Last Signin']=count() by startofmonth(TimeGenerated)
| render columnchart with (title="Guest inactivity per month")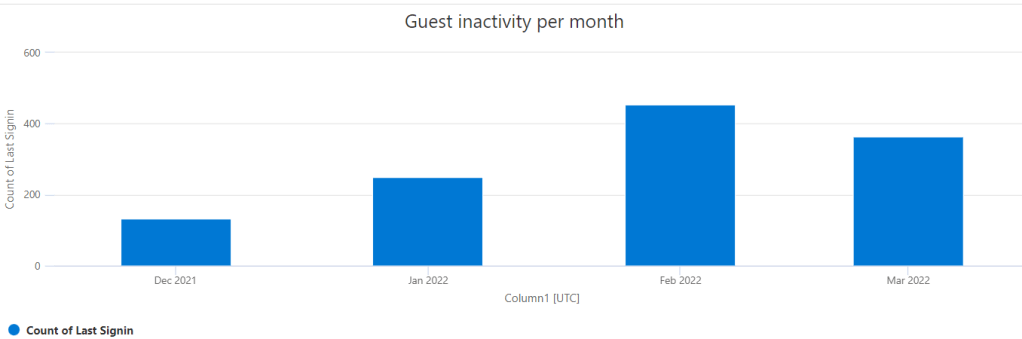
Another interesting thing with Azure AD guests is that invites never expire. So once you invite a guest the pending invite will be there forever. You can use KQL to find invites that have been sent but not redeemed.
let timerange=180d;
let timeframe=30d;
AuditLogs
| where TimeGenerated between (ago(timerange) .. ago(timeframe))
| where OperationName == "Invite external user"
| extend GuestUPN = tolower(tostring(TargetResources[0].userPrincipalName))
| summarize arg_max(TimeGenerated, *) by GuestUPN
| project TimeGenerated, GuestUPN
| join kind=leftanti  (
    AuditLogs
    | where TimeGenerated > ago (timerange)
    | where OperationName == "Redeem external user invite"
    | where CorrelationId <> "00000000-0000-0000-0000-000000000000"
    | extend d = tolower(tostring(TargetResources[0].displayName))
    | parse d with * "upn: " GuestUPN "," *
    | project TimeGenerated, GuestUPN)
    on GuestUPN
| project TimeGenerated, GuestUPN, ['Days Since Invite Sent']=datetime_diff("day", now(), TimeGenerated)
For this we join two queries – guest invites and guest redemptions. Then search for when there isn’t a redemption. We then re-use our datetime_diff to work out how many days since the invite was sent. For this query we also exclude invites sent in the last 30 days. Those guests may just not have gotten around to redeeming their invites yet. Once a user has been invited, the user object already exists in your tenant. It just sits there idle until they redeem the invite. If they haven’t accepted the invite in 45 days, then it is probably best to delete the user objects.
Service Principals
The great thing about KQL is once we write a query we like, we can easily re-use it. Service principals are everything in Azure AD. They control what your applications can access. Much like users, we may no longer be using service principals. Perhaps that application has been decommissioned. Maybe the integration that was in use has been retired. Much like users, if they are no longer in use, we should remove them.
Let’s re-use our inactive user query, and this time look for inactive service principals.
AADServicePrincipalSignInLogs
| where TimeGenerated > ago(365d)
| where ResultType == "0"
| summarize arg_max(TimeGenerated, *) by AppId
| project TimeGenerated, ServicePrincipalName, ['Days Since Last Logon']=datetime_diff("day", now(),TimeGenerated)
| where ['Days Since Last Logon'] >= 45 | sort by ['Days Since Last Logon'] desc
Have a look through the list and see which can be deleted.
Service principals can fail to sign in for many reasons, much like regular users. With regular users though we get an easy to read description that can help us out. With service principals, we unfortunately just get an error code. Using the case operator we can add our own friendly descriptions to help us out. We just say, when our result code is this, then provide us an easy to read description.
AADServicePrincipalSignInLogs
| where ResultType != "0"
| extend ErrorDescription = case (
    ResultType == "7000215", strcat("Invalid client secret is provided"),
    ResultType == "7000222", strcat("The provided client secret keys are expired"),
    ResultType == "700027", strcat("Client assertion failed signature validation"),
    ResultType == "700024", strcat("Client assertion is not within its valid time range"),
    ResultType == "70021", strcat("No matching federated identity record found for presented assertion"),
    ResultType == "500011", strcat("The resource principal named {name} was not found in the tenant named {tenant}"),
    ResultType == "700082", strcat("The refresh token has expired due to inactivity"),
    ResultType == "90025", strcat("Request processing has exceeded gateway allowance"),
    ResultType == "500341", strcat("The user account {identifier} has been deleted from the {tenant} directory"),
    ResultType == "100007", strcat("AAD Regional ONLY supports auth either for MSIs OR for requests from MSAL using SN+I for 1P apps or 3P apps in Microsoft infrastructure tenants"),
    ResultType == "1100000", strcat("Non-retryable error has occurred"),
    ResultType == "90033", strcat("A transient error has occurred. Please try again"),
    ResultType == "53003",strcat("Access has been blocked by Conditional Access policies. The access policy does not allow token issuance."),
    "Unknown"
    )
| project TimeGenerated, ServicePrincipalName, ServicePrincipalId, ErrorDescription, ResultType, IPAddress
You may be particularly interested in signins with expired or invalid secrets. Are the service principals still in use? Perhaps you can remove them. Or you may be interested where conditional access blocks a service principal sign-in.

Have the credentials for that service principal leaked? It may be worth investigating and rotating credentials if required.
Enterprise Applications
For applications that have had no sign in activity for a long time that could be a sign of a couple of things. Firstly, you may have retired that application. If that is the case, then you should delete the enterprise application from your tenant.
Secondly, it may mean that people are bypassing SSO to access the application. For example, you may use a product like Confluence. You may have enabled SSO to it, but users still have the ability to sign on using ‘local’ credentials. Maybe users do that because it is more convenient to bypass conditional access. For those applications you know are still in use, but you aren’t seeing any activity you should investigate. If the applications have the ability to prevent the use of local credentials then you should enable that. Perhaps you have the ability to set the password for local accounts, you could set them to something random the users don’t know to enforce SSO.
If those technical controls don’t exist, you may need to try softer controls. You should try get buy in from the application owners or users and explain the risks of local credentials. A good point to highlight is that when a user leaves an organization then their account is disabled. When that happens, they lose access to any SSO enforced applications. In applications that use local credentials the lifecycle of accounts is likely poorly managed. Application owners usually don’t want ex employees still having access to data, so that may help enforce good behaviour.
We can find apps that have had no sign ins in the last 30 days easily.
SigninLogs
| where TimeGenerated > ago (365d)
| where ResultType == 0
| summarize arg_max(TimeGenerated, *) by AppId
| project
    AppDisplayName,
    ['Last Logon Time']=TimeGenerated,
    ['Days Since Last Logon']=datetime_diff("day", now(), TimeGenerated)
| where ['Days Since Last Logon'] > 30 | sort by ['Days Since Last Logon'] desc 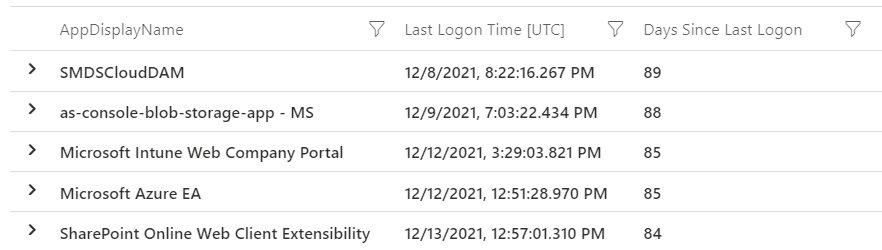
Maybe you are interested in application usage more generally. We can bring back some stats for each of your applications. Perhaps you want to see total sign ins to each vs distinct sign ins. Some applications may be very noisy with their sign in data. But when you look at distinct users, they aren’t as busy as you thought.
SigninLogs
| where TimeGenerated > ago(30d)
| where ResultType == 0
| summarize ['Total Signins']=count(), ['Distinct User Signins']=dcount(UserPrincipalName) by AppDisplayName | sort by ['Distinct User Signins'] desc 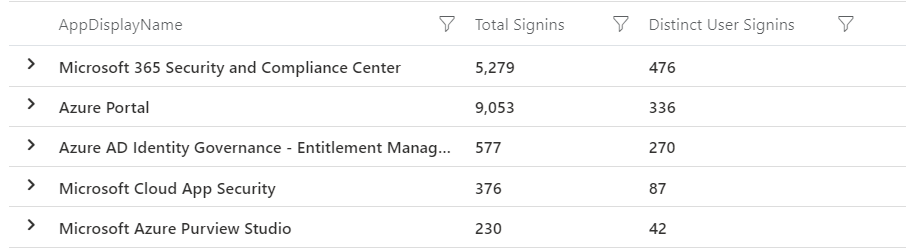
You may be also interested in the breakdown of guests vs members for each application. Maybe guests are accessing something they aren’t meant to. If you notice that you can put a group in front of that app to control access.
For this query we use the dcountif operator. Which returns a distinct count of a column where something is true. So for this example, we return a distinct user count where the UserType is a member. Then again for guests.
SigninLogs
| where TimeGenerated > ago(30d)
| where ResultType == 0
| summarize ['Distinct Member Signins']=dcountif(UserPrincipalName, UserType == "Member"), ['Distinct Guest Signins']=dcountif(UserPrincipalName, UserType == "Guest") by AppDisplayName | sort by ['Distinct Guest Signins'] 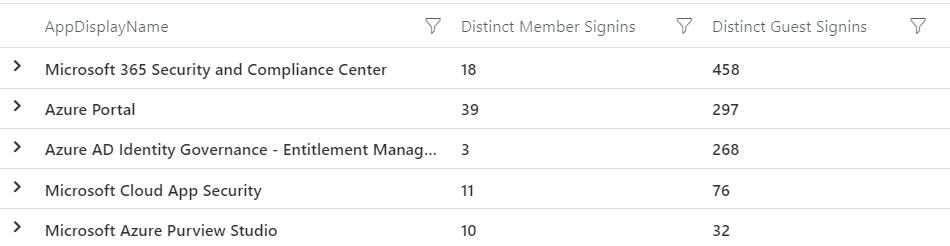
Use your knowledge of your environment to make sense of the results. If you have lots of guests accessing something you didn’t expect, then investigate.
Privileged Access
As always, your privileged users deserve a more scrutiny. You can detect when a user accesses particular Azure applications for the first time. This query looks back 90 days, then detects if a user accesses one of these applications for the first time.
//Detects users who have accessed Azure AD Management interfaces who have not accessed in the previous timeframe
let timeframe = startofday(ago(90d));
let applications = dynamic(["Azure Active Directory PowerShell", "Microsoft Azure PowerShell", "Graph Explorer", "ACOM Azure Website"]);
SigninLogs
| where TimeGenerated > timeframe and TimeGenerated < startofday(now())
| where AppDisplayName in (applications)
| project UserPrincipalName, AppDisplayName
| join kind=rightanti
    (
    SigninLogs
    | where TimeGenerated > startofday(now())
    | where AppDisplayName in (applications)
    )
    on UserPrincipalName, AppDisplayName
| where ResultType == 0
| project TimeGenerated, UserPrincipalName, ResultType, AppDisplayName, IPAddress, Location, UserAgent
You could expand the list to include privileged applications specific to your environment too.
If you use Azure AD Privileged Identity Management (PIM) you can keep an eye on those actions too. For example, we can find users who haven’t elevated to a role for over 30 days. If you have users with privileged roles but they aren’t actively using them then they should be removed. This query also returns you the role which they last activated.
AuditLogs
| where TimeGenerated > ago (365d)
| project TimeGenerated, OperationName, Result, TargetResources, InitiatedBy
| where OperationName == "Add member to role completed (PIM activation)"
| where Result == "success"
| extend ['Last Role Activated'] = tostring(TargetResources[0].displayName)
| extend Actor = tostring(parse_json(tostring(InitiatedBy.user)).userPrincipalName)
| summarize arg_max(TimeGenerated, *) by Actor
| project Actor, ['Last Role Activated'], ['Last Activation Time']=TimeGenerated, ['Days Since Last Activation']=datetime_diff("day", now(), TimeGenerated)
| where ['Days Since Last Activation'] >= 30
| sort by ['Days Since Last Activation'] desc
One of the biggest strengths of KQL is manipulating time. We can use that capability to add some logic to our queries. For example, we can find PIM elevation events that are outside of business hours.
let timerange=30d;
AuditLogs
// extend LocalTime to your time zone
| extend LocalTime=TimeGenerated + 5h
| where LocalTime > ago(timerange)
// Change hours of the day to suit your company, i.e this would find activations between 6pm and 6am
| where hourofday(LocalTime) !between (6 .. 18)
| where OperationName == "Add member to role completed (PIM activation)"
| extend RoleName = tostring(TargetResources[0].displayName)
| project LocalTime, OperationName, Identity, RoleName, ActivationReason=ResultReason
If this is unexpected behaviour for you then it’s worth looking at. Maybe an account has been compromised. Or it could be a sign of malicious insider activity from your admins.
MFA & Passwordless
In a perfect world we would have MFA on everything. That may not be the reality in your tenant. In fact, it’s not the reality in many tenants. For whatever reason your MFA coverage may be patchy. You could be on a roadmap to deploying it, or trying to onboard applications to SSO.
Our sign on logs provide great insight to single factor vs multi factor connections. We can summarize and visualize that data in different ways to track your MFA progress. If you want to just look across your tenant as a whole we can do that of course.
SigninLogs
| where TimeGenerated > ago (30d)
| summarize ['Single Factor Authentication']=countif(AuthenticationRequirement == "singleFactorAuthentication"), ['Multi Factor Authentication']=countif(AuthenticationRequirement == "multiFactorAuthentication") by bin(TimeGenerated, 1d)
| render timechart with (ytitle="Count", title="Single vs Multifactor Authentication last 30 days")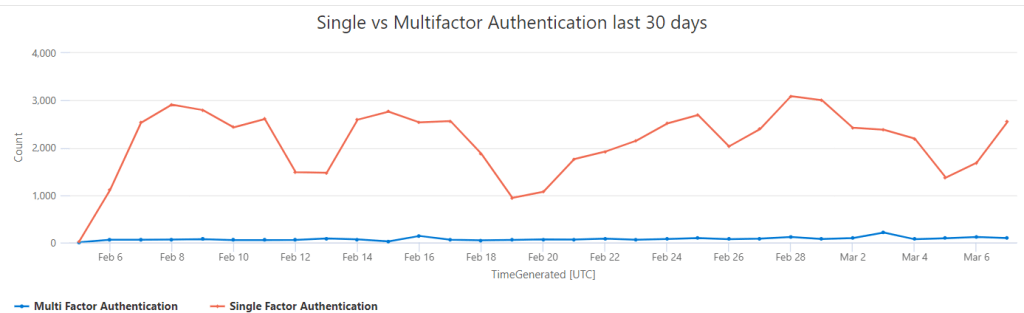
There is some work to be done in the demo tenant!
You can even build a table out of all your applications. From that we can count the percentage of sign ins that are covered by MFA. This may give you some direction to enabling MFA.
let timerange=30d;
SigninLogs
| where TimeGenerated > ago(timerange)
| where ResultType == 0
| summarize
    TotalCount=count(),
    MFACount=countif(AuthenticationRequirement == "multiFactorAuthentication"),
    nonMFACount=countif(AuthenticationRequirement == "singleFactorAuthentication")
    by AppDisplayName
| project AppDisplayName, TotalCount, MFACount, nonMFACount, MFAPercentage=(todouble(MFACount) * 100 / todouble(TotalCount))
| sort by MFAPercentage desc 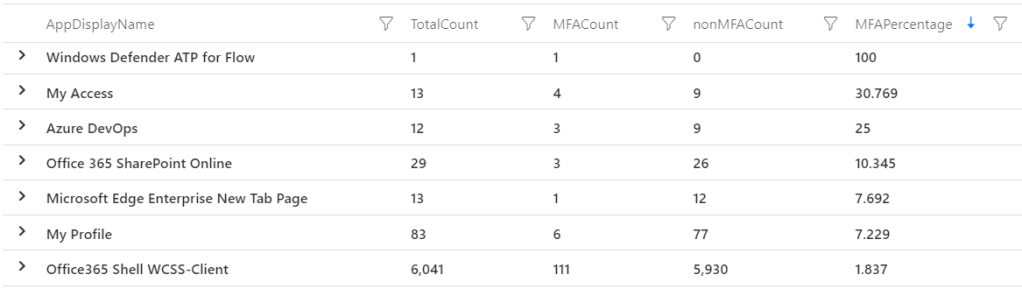
If that much data is too overwhelming, why not start with your most popular applications? Here we use the same logic, but first calculate our top 20 applications.
let top20apps=
    SigninLogs
    | where TimeGenerated > ago (30d)
    | summarize UserCount=dcount(UserPrincipalName)by AppDisplayName
    | sort by UserCount desc
    | take 20
    | project AppDisplayName;
//Use that list to calculate the percentage of signins to those apps that are covered by MFA
SigninLogs
| where TimeGenerated > ago (30d)
| where AppDisplayName in (top20apps)
| summarize TotalCount=count(),
    MFACount=countif(AuthenticationRequirement == "multiFactorAuthentication"),
    nonMFACount=countif(AuthenticationRequirement == "singleFactorAuthentication")
    by AppDisplayName
| project AppDisplayName, TotalCount, MFACount, nonMFACount, MFAPercentage=(todouble(MFACount) * 100 / todouble(TotalCount))
| sort by MFAPercentage asc
Passwordless technology has been around for a little while now, but it is only starting now to hit mainstream. Azure AD provides lots of different options. FIDO2 keys, Windows Hello for Business, phone sign in etc. You can track password vs passwordless sign ins to your tenant.
let timerange=180d;
SigninLogs
| project TimeGenerated, AuthenticationDetails
| where TimeGenerated > ago (timerange)
| extend AuthMethod = tostring(parse_json(AuthenticationDetails)[0].authenticationMethod)
| where AuthMethod != "Previously satisfied"
| summarize
    Password=countif(AuthMethod == "Password"),
    Passwordless=countif(AuthMethod in ("FIDO2 security key", "Passwordless phone sign-in", "Windows Hello for Business", "Mobile app notification","X.509 Certificate"))
    by startofweek(TimeGenerated)
| render timechart  with ( xtitle="Week", ytitle="Signin Count", title="Password vs Passwordless signins per week")
Passwordless needs a little more love in the demo tenant for sure!
You could even go one better, and track each type of passwordless technology. Then you can see what is the most favored.
let timerange=180d;
SigninLogs
| project TimeGenerated, AuthenticationDetails
| where TimeGenerated > ago (timerange)
| extend AuthMethod = tostring(parse_json(AuthenticationDetails)[0].authenticationMethod)
| where AuthMethod in ("FIDO2 security key", "Passwordless phone sign-in", "Windows Hello for Business", "Mobile app notification","X.509 Certificate")
| summarize ['Passwordless Method']=count()by AuthMethod, startofweek(TimeGenerated)
| render timechart with ( xtitle="Week", ytitle="Signin Count", title="Passwordless methods per week")
Legacy Authentication
There is no better managed Azure AD tenant than one where legacy auth is completely disabled. Legacy auth is a security issue because it isn’t MFA aware. If one of your users are compromised, they could bypass MFA policies by using legacy clients such as IMAP or ActiveSync. The only conditional access rules that work for legacy auth are allow or block. Because conditional access defaults to allow, unless you explicitly block legacy auth, those connections will be allowed.
Microsoft are looking to retire legacy auth in Exchange Online on October 1st, 2022 which is fantastic. However, legacy auth can be used for non Exchange Online workloads. We can use our sign in log data to track exactly where legacy auth is used. That way we can not only be ready for October 1, but maybe we can retire it from our tenant way before then. Win win!
The Azure AD sign in logs contain useful information about what app is being used during a legacy sign in. Let’s start there and look at all the various legacy client apps. We can also retrieve the users for each.
SigninLogs
| where TimeGenerated > ago(30d)
| where ResultType == 0
| where ClientAppUsed in ("Exchange ActiveSync", "Exchange Web Services", "AutoDiscover", "Unknown", "POP3", "IMAP4", "Other clients", "Authenticated SMTP", "MAPI Over HTTP", "Offline Address Book")
| summarize ['Count of legacy auth attempts'] = count()by ClientAppUsed, UserPrincipalName
| sort by ClientAppUsed asc, ['Count of legacy auth attempts'] desc
This will show us each client app, such as IMAP or Activesync. For each app it lists the most active users for each. That will give you good direction to start migrating users and applications to modern auth.
If you want to visualize how you are going with disabling legacy auth, we can do that too. We can even compare that to how many legacy auth connections are blocked.
SigninLogs
| where TimeGenerated > ago(180d)
| where ResultType in ("0", "53003")
| where ClientAppUsed in ("Exchange ActiveSync", "Exchange Web Services", "AutoDiscover", "Unknown", "POP3", "IMAP4", "Other clients", "Authenticated SMTP", "MAPI Over HTTP", "Offline Address Book")
| summarize
    ['Legacy Auth Users Allowed']=dcountif(UserPrincipalName, ResultType == 0),
    ['Legacy Auth Users Blocked']=dcountif(UserPrincipalName, ResultType == 53003)
    by bin(TimeGenerated, 1d)
| render timechart with (ytitle="Count",title="Legacy auth distinct users allowed vs blocked by Conditional Access")
Hopefully your allowed connections are on the decrease.
You may be wondering why blocks aren’t increasing at the same time. That is easily explained. For instance, say you migrate from Activesync to using the Outlook app on your phone. Once you make that change, there simply won’t be legacy auth connection to block anymore. Visualizing the blocks however provides a nice baseline. If you see a sudden spike, then something out there is still trying to connect and you should investigate.
Conditional Access
Azure AD conditional access is key to security for your Azure AD tenant. It decides who is allowed in, or isn’t. It also defines the rules people must follow to be allowed in. For instance, requiring multi factor authentication. Azure AD conditional access evaluates every sign into your tenant, and decides if they are approved to enter. The detail for conditional access evaluation is held within every sign in event. If we look at a sign in event from the demo environment, we can see what this data looks like.

So Azure AD evaluated this sign in. It determined the policy ‘MeganB MCAS Proxy’ was in scope for this sign in. So then it enforced the sign in to go through Defender for Cloud Apps (previously Cloud App Security). You can imagine if you have lots of policies, and lots of sign ins, this is a huge amount of data. We can summarize this data in lots of ways. Like any security control, we should regularly review to confirm that control is in use. We can find any policies that have had either no success events (user allowed in). And also no failure events (user blocked).
SigninLogs
| where TimeGenerated > ago (30d)
| project TimeGenerated, ConditionalAccessPolicies
| mv-expand ConditionalAccessPolicies
| extend CAResult = tostring(ConditionalAccessPolicies.result)
| extend CAPolicyName = tostring(ConditionalAccessPolicies.displayName)
| summarize CAResults=make_set(CAResult) by CAPolicyName
| where CAResults !has "success" and CAResults !has "failure"
In this test tenant we can see some policies that we have a hit on.
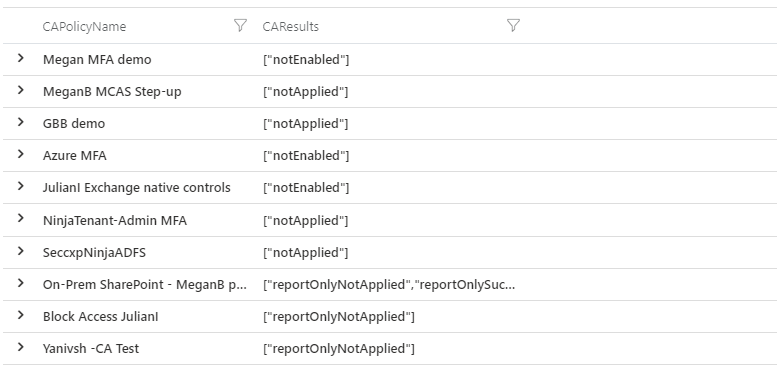
Some of these policies are not enabled. Some are in report only mode. Or they are simply not applying to any sign ins. You should review this list to make sure it is what you expect. If you are seeing lots of ‘notApplied’ results, make sure you have configured your policies properly.
If you wanted to focus on conditional access failures specifically, you can do that too. This query will find any policy with failures, then return the reason for the failure. This can be simply informational for you to show they are working as intended. Or if you are getting excessive failures maybe your policy needs tuning.
SigninLogs
| where TimeGenerated > ago (30d)
| project TimeGenerated, ConditionalAccessPolicies, ResultType, ResultDescription
| mv-expand ConditionalAccessPolicies
| extend CAResult = tostring(ConditionalAccessPolicies.result)
| extend CAPolicyName = tostring(ConditionalAccessPolicies.displayName)
| where CAResult == "failure"
| summarize CAFailureCount=count()by CAPolicyName, ResultType, ResultDescription
| sort by CAFailureCount desc 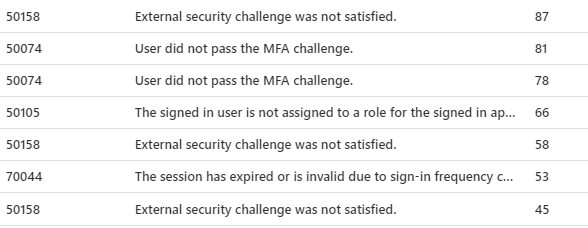
You could visualize the same failures if you wanted to look at any trends or spikes.
let start = now(-90d);
let end = now();
let timeframe= 12h;
SigninLogs
| project TimeGenerated, ResultType, ConditionalAccessPolicies
| where ResultType == 53003
| extend FailedPolicy = tostring(ConditionalAccessPolicies[0].displayName)
| make-series FailureCount = count() default=0 on TimeGenerated in range(start,end, timeframe) by FailedPolicy
| render timechart 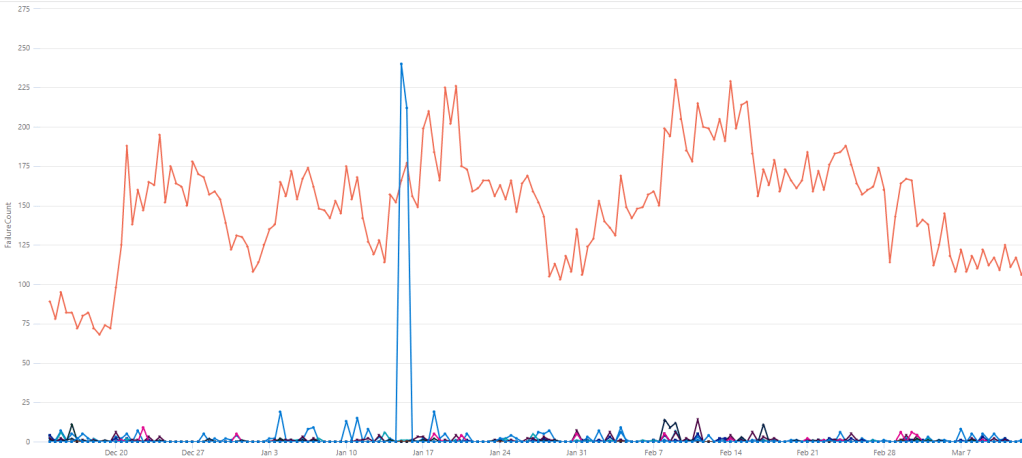
Summary
I have provided you with a few examples of different queries to help manage your tenant. KQL gives you the power to manipulate your data in so many ways. Have a think about what is important to you. You can then hopefully use the above examples as a starting point to find what you need.
If you are licensed for the Microsoft provided tools then definitely use them. However if there are gaps, don’t be scared of looking at the data yourself. KQL is powerful and easy to use.
There are also a number of provided workbooks in your Azure AD tenant you can use too. You can find them under ‘workbooks’ in Azure AD. They cover some queries similar to this, and plenty more.
You need to combine the Microsoft tools and your own knowledge to effectively manage your directory.
Just one word. Brilliant.
At FMG you said you loved Kusto, im beginning to see why that is the case. Blog is both informative and useful in practice
LikeLike
Just one word. Brilliant.
At FMG you said you loved Kusto, im beginning to see why that is the case. Blog is both informative and useful in practice
LikeLike
Awesome article. I found an issue with a customer and using Last Sign In. More of an issue with AAD by the looks of it. The userPrincipal field name ended up with the userID in it. So some users were showing twice as they were getting summarized by UPN and UserId in the UserPrincialName field. Not sure if this has happened with anyone else.
SigninLogs
| where TimeGenerated > ago(365d)
| where ResultType == “0”
| summarize arg_max(TimeGenerated, *) by UserPrincipalName
| project TimeGenerated, UserPrincipalName, UserType, [‘Days Since Last Logon’]=datetime_diff(“day”, now(),TimeGenerated)
| where [‘Days Since Last Logon’] >= 45 | sort by [‘Days Since Last Logon’] desc
Changed to summarize by UserId
SigninLogs
| where TimeGenerated > ago(365d)
| where ResultType == “0”
| summarize arg_max(TimeGenerated, *) by UserId
| project TimeGenerated, UserPrincipalName, UserType, [‘Days Since Last Logon’]=datetime_diff(“day”, now(),TimeGenerated)
| where [‘Days Since Last Logon’] >= 45 | sort by [‘Days Since Last Logon’] desc
LikeLike
Sorry I seem to have not gotten notifications for some comments, so this reply is super late! Yes, I notice that too sometimes with AAD logs, one way to exclude rows where the UPN shows up as a guid
Cast a regex as a variable before your query, then exclude it
let isGUID = “[0-9a-z]{8}-[0-9a-z]{4}-[0-9a-z]{4}-[0-9a-z]{4}-[0-9a-z]{12}”;
SigninLogs
| where TimeGenerated > ago(365d)
| where not(UserPrincipalNamematches regex isGUID)
| where ResultType == “0”
| summarize arg_max(TimeGenerated, *) by UserPrincipalName
| project TimeGenerated, UserPrincipalName, UserType, [‘Days Since Last Logon’]=datetime_diff(“day”, now(),TimeGenerated)
| where [‘Days Since Last Logon’] >= 45 | sort by [‘Days Since Last Logon’] desc
LikeLike
Thank you for that, just amazing.
LikeLike
This is awesome! One thing to mention is that one need to be careful when looking for UserType == “Guest”. I’ve noticed that AAD SigningLogs marks my internal users as “Guest” when they access resource from a different tenant (home tenant != resource tenant), say SharePoint from external vendor etc. I guess adding a logic to exclude a condition like if home tenant == ‘x’ and home tenant != resource tenant, skip it.
LikeLike
Good point! Will update the queries to include that logic
LikeLike
1 Pingback