
If you follow my Twitter or GitHub account, you know that I recently completed a #365daysofKQL challenge. Where I shared a hunting query each day for a year. To round out that challenge, I wanted to share what I have learnt over the year. Like any activity, the more you practice, the better you become at it. At about day 200, I went back to a lot of queries and re-wrote them with things I had picked up. I wanted to make my queries easier to read and more efficient. Some people also asked if I was ever short of ideas. I never had writers block or struggled to come up with ideas. I am a naturally curious person, so looking through data sets is interesting to me. On top of that there is always a new threat, or a new vulnerability around. Threat actors come up with new tactics and you can then try and find those. Then you can take those queries and apply them to other data sets. On top of that, vendors, especially Microsoft are always adding new data in. There is always something new to look at.

I have also learned that KQL is a very repeatable language. You can build ‘styles’ of queries, and then re-use those on different logs. If you are looking for the first time something happened. Or if something happened at a weird time of the day. That becomes a query pattern. Sure, the content of the data you are looking at may change. The structure of the query remains the same.
So without further ado, what I have learnt writing 365 queries.
Use your own account and privilege to generate alerts
If you follow InfoSec news, there is always a new activity you may want to alert on. As these new threats are uncovered, hopefully you don’t find them in your environment. But you want to be ready. I find it valuable to look at the details and attempt to create those logs and then go find them. From there you can tidy your query up so it is accurate. You don’t want to run malicious code or do anything that will cause an outage. You can certainly simulate the adversary though. Take for instance consent phishing. You don’t want to actually install a malicious app. You can register an app manually though. You could then query your Azure AD audit logs to find that event. Start really broadly with just seeing what you have done with your account.
AuditLogs
| where InitiatedBy contains "youruseraccount"
You will see an event ‘Add service principal’, that is what we are after. In the Azure AD audit log, this is a ‘OperationaName’. So we can then tune our query. We know we want any ‘Add service principal’ events. We can also look through and see where our username is and our IP. So we can extend those to new columns. For our actual query we don’t want to include our user account, so take that out.
AuditLogs
| where OperationName == "Add service principal"
| extend Actor = tostring(parse_json(tostring(InitiatedBy.user)).userPrincipalName)
| extend IPAddress = tostring(parse_json(tostring(InitiatedBy.user)).ipAddress)
| project TimeGenerated, OperationName, Actor, IPAddress
Now we have a query that detects each time someone adds a service principal. If someone is consent phished, this will tell us. Then we can investigate. We can then delete our test service principal out to clean up our tenant.
Look for low volume events
One of the best ways to find interesting events, is to find those that are low volume. While not always malicious they are generally worth investigating. Using our Azure AD audit log example, it is simple to find low volume events.
AuditLogs
| summarize Count=count() by OperationName, LoggedByService
| sort by Count asc
This will return the count of all the operations in Azure AD for you, and list those with the fewest hits first. It will also return which service in Azure AD triggered it. Your data will look different to mine, but as an example you may see.

Now you look at this list and you can see if any interest you. Maybe you want to know each time an Azure AD Conditional Policy is updated. We can see that event. Or when a BitLocker key is read. You can then take those operations and start building your queries out.
You can do the same on other data sources, like Office 365.
OfficeActivity
| summarize Count=count() by Operation, OfficeWorkload
| sort by Count asc
The data is a little different, we have Operation instead of OperationName. And we have OfficeWorkload instead of LoggedByService. But the pattern is the same. This time we are returned low count events from the Office 365 audit log.
Look for the first time something occurs and new events
This is a pattern I love using. We can look at new events in our environment that we haven’t previously seen. Like me, I am sure you struggle with new alerts, or new log sources to your environment. Let KQL do it for you. These queries are simple and easily re-useable. Again, let’s use our Azure AD audit log as an example.
let existingoperations=
    AuditLogs
    | where TimeGenerated > ago(180d) and TimeGenerated < ago(7d)
    | distinct OperationName;
AuditLogs
| where TimeGenerated > ago(7d)
| summarize Count=count() by OperationName, Category
| where OperationName !in (existingoperations)
| sort by Count desc
First we cast a variable called ‘existingoperations’. That queries our audit log for events between 180 and 7 days ago. From that list, we just list each distinct OperationName. That becomes our list of events that have already occurred.
We then re-query the audit log again, this time just looking at the last week. We take a count of all the operations. Then we exclude the ones we already knew about from our first query. Anything remaining is new to our environment. Have a look through the list and see if anything is interesting to you. If it is, then you can write your specific query.
Look for when things stop occurring
The opposite to new events occurring is when events stop occurring. One of the most common use cases for this kind of query is tell me when a device is no longer sending logs. To keep on top of detections we need to make sure devices are still sending their logs.
SecurityEvent
| where TimeGenerated > ago (1d)
| summarize ['Last Record Received']  = datetime_diff("minute", now(), max(TimeGenerated)) by Computer
| project Computer, ['Last Record Received']
| where ['Last Record Received'] >= 60
| order by ['Last Record Received'] desc
This query will find any device that hasn’t send a security event log in over 60 minutes in the last day. Maybe the machine is offline, or there are network issues? Worth checking out either way.
We can use that same concept to find all kinds of things. How about user accounts no longer signing in? That is also something that is no longer occurring. This time though, it isn’t really an ‘alert’. It is great way to clean up user accounts though.
SigninLogs
| where TimeGenerated > ago (365d)
| where ResultType == 0
| where isnotempty(UserType)
| summarize arg_max(TimeGenerated, *) by UserPrincipalName
| where TimeGenerated < ago(60d)
| summarize
    ['Inactive Account List']=make_set(UserPrincipalName),
    ['Count of Inactive Accounts']=dcount(UserPrincipalName)
    by UserType, Month=startofmonth(TimeGenerated)
| sort by Month desc, UserType asc
We can find all our user accounts, both members and guests, that haven’t signed in for more than 60 days. We can also retrieve the last month they last accessed our tenant.
Look for when things occur at strange times
KQL is amazing at dealing with time data. We can include any kind of logic into our queries to detect only during certain times. Or on certain days. Or a combination of both. An event that happens over a weekend of outside of working hours perhaps requires a faster response. A couple of good examples this are Azure AD Privileged Identity Management and adding a service principal to Azure AD. Maybe Monday to Friday, during business hours these activities are pretty normal. Outside of that though? We can tell KQL to focus on those times.
let Saturday = time(6.00:00:00);
let Sunday = time(0.00:00:00);
AuditLogs
// extend LocalTime to your time zone
| extend LocalTime=TimeGenerated + 5h
| where LocalTime > ago(7d)
// Change hours of the day to suit your company, i.e this would find activations between 6pm and 6am
| where hourofday(LocalTime) !between (6 .. 18) or hourofday(LocalTime)
| where OperationName == "Add member to role completed (PIM activation)"
| extend User = tostring(parse_json(tostring(InitiatedBy.user)).userPrincipalName)
| extend ['Azure AD Role Name'] = tostring(TargetResources[0].displayName)
| project LocalTime, User, ['Azure AD Role Name'], ['Activation Reason']=ResultReason
This query searches for PIM activations on weekends or between 6pm and 6am during the week. You can then re-use that same logic to detect on other things during those times.
Summarize to make sense of large data sets
I have written about data summation previously. If you send data to Sentinel chances are you will have a lot of it. Even a small Azure AD tenant generates a lot of data. 150 devices in Defender is a lot of logs. Summarizing data in KQL is both easy and useful. Maybe you are interested in what your users are doing when they connect to other tenants. Each log entry on its own probably isn’t exciting. If you allow that activity then it isn’t really a detection. You wouldn’t generate an alert each time someone accessed another tenant. You may be interested in other tenants more broadly though.
SigninLogs
| where TimeGenerated > ago(30d)
| where UserType == "Guest"
| where AADTenantId == HomeTenantId
| where ResourceTenantId != AADTenantId
| summarize
    ['Count of Applications']=dcount(AppDisplayName),
    ['List of Applications']=make_set(AppDisplayName),
    ['Count of Users']=dcount(UserPrincipalName),
    ['List of Users']=make_set(UserPrincipalName)
    by ResourceTenantId
| sort by ['Count of Users'] desc
This query looks for each ResourceTenantId. Which is the Id of the tenant your users are accessing. For each tenant, it returns what applications, a count of applications, which users and a count of users accessing it. Maybe you see in that data there is one tenant that your users are accessing way more than any other. It may be worth investigating why or adding additional controls to that tenant via cross-tenant settings.
Another good example, we can use Defender for Endpoint logs for all kinds of great info. Take for example LDAP and LDAPS traffic. Hopefully you want to migrate to LDAPS, which is more secure. If you look at each LDAP event to see what’s in your environment, it will be overwhelming. Chances are you will get thousands of results a day.
DeviceNetworkEvents
| where ActionType == "InboundConnectionAccepted"
| where LocalPort in ("389", "636", "3269")
| summarize
    ['Count of Inbound LDAP Connections']=countif(LocalPort == 389),
    ['Count of Distinct Inbound LDAP Connections']=dcountif(RemoteIP, LocalPort == 389),
    ['List of Inbound LDAP Connections']=make_set_if(RemoteIP, LocalPort == 389),
    ['Count of Inbound LDAPS Connections']=countif(LocalPort in ("636", "3269")),
    ['Count of Distinct Inbound LDAPS Connections']=dcountif(RemoteIP, LocalPort in ("636", "3269")),
    ['List of Inbound LDAPS Connections']=make_set_if(RemoteIP, LocalPort in ("636", "3269"))
    by DeviceName
| sort by ['Count of Distinct Inbound LDAP Connections'] desc
This query looks at all those connections, and summarizes it down so it’s easier to read. For each device on our network we summarize those connections. For each we get the total count of connections, a count of distinct endpoints and the list of endpoints. Maybe we have thousands and thousands of events per day. When we run this query though, it is really just a handful of noisy machines. Suddenly that LDAPS migration isn’t so daunting.
Change your data summary to change context
Once you have written your queries that summarize your data, you can then change the context easily. You can basically re-use your work and see something different in the same data. Take these two queries.
DeviceNetworkEvents
| where TimeGenerated > ago(30d)
| where ActionType == "ConnectionSuccess"
| where RemotePort == "3389"
//Exclude Defender for Identity that uses an initial RDP connection to map your network
| where InitiatingProcessCommandLine <> "\"Microsoft.Tri.Sensor.exe\""
| summarize
    ['RDP Outbound Connection Count']=count(),
    ['RDP Distinct Outbound Endpoint Count']=dcount(RemoteIP),
    ['RDP Outbound Endpoints']=make_set(RemoteIP)
    by DeviceName
| sort by ['RDP Distinct Outbound Endpoint Count'] desc
This first query finds which devices in your environment connect to the most other endpoints via RDP. These devices are a target for lateral movement as they have more credentials stored on them.
DeviceLogonEvents
| where TimeGenerated > ago(30d)
| project DeviceName, ActionType, LogonType, AdditionalFields, InitiatingProcessCommandLine, AccountName, IsLocalAdmin
| where ActionType == "LogonSuccess"
| where LogonType == "Interactive"
| where AdditionalFields.IsLocalLogon == true
| where InitiatingProcessCommandLine == "lsass.exe"
| summarize
    ['Local Admin Count']=dcountif(DeviceName,IsLocalAdmin == "true"),
    ['Local Admins']=make_set_if(DeviceName, IsLocalAdmin == "true")
    by AccountName
| sort by ['Local Admin Count'] desc
This second query looks for logon events from your devices. It finds the users that have accessed the most devices as a local admin. Which will find us which accounts are targets for lateral movement.
So two very similar queries. Both provide information about lateral movement targets. However, we change our summary target so we get unique context in the results.
Try to write queries looking for behavior rather than static IOCs
This is another topic I have written about before. We want to, where possible, create queries based on behavior rather than specific IOCs. While IOCs are useful in threat hunting, they are likely to change quickly.
Say for example you read a report about a new threat. It says in there that the threat actor used certutil.exe to connect to 10.10.10.10.
We could write a query to catch that.
DeviceNetworkEvents
| project TimeGenerated, DeviceName, InitiatingProcessAccountName, InitiatingProcessCommandLine, LocalIPType,LocalIP, RemoteIPType, RemoteIP, RemoteUrl, RemotePort
| where InitiatingProcessCommandLine contains "certutil"
| where RemoteIP == "10.10.10.10"
Easy, we will catch if someone uses certutil.exe to connect to 10.10.10.10.
What if the IP changes though? Now the malicious server is on 10.20.20.20. Our query no longer will catch it. So instead go a little broader, and catch the behavior.
DeviceNetworkEvents
| project TimeGenerated, DeviceName, InitiatingProcessAccountName, InitiatingProcessCommandLine, LocalIPType,LocalIP, RemoteIPType, RemoteIP, RemoteUrl, RemotePort
| where InitiatingProcessCommandLine contains "certutil"
| where RemoteIPType == "Public"
The query now detects any usage of certutil.exe connecting to any public endpoint. I would suspect this is very rare behavior in most environments. Now it is irrelevant what the IP is, we will catch it.
Use your data to uplift your security posture
Not every query you write needs to be about threat detection. Of course we want to catch attackers. We can however use the same data to provide amazing insights about security posture. Take for instance Azure Active Directory sign in logs. We can detect when someone signs in from a suspicious country. Just as useful though is all the other data contained in those logs. We can see visibility into conditional access policies, legacy authentication, MFA events, device and location information.
Legacy authentication is always in the news. There is no way to put MFA in front of it, so it is the first door attackers knock on. We can use our sign in data to see just how big a legacy authentication problem we have.
SigninLogs
| where TimeGenerated > ago(30d)
| where ResultType == 0
| where ClientAppUsed !in ("Mobile Apps and Desktop clients", "Browser")
| where isnotempty(ClientAppUsed)
| evaluate pivot(ClientAppUsed, count(), UserPrincipalName)
This query finds any apps that make up legacy authentication. Those that aren’t a modern app or a browser. Then it creates a easy to read pivot table. The table will show each user that has connected with legacy authentication. For each app it will give you a count. Maybe you have 25000 legacy authentication connections in a month, which seems impossible to address. When you look at it closer though, it may just be a few dozen users.
Similarly, you could try to improve your MFA posture.
SigninLogs
| where TimeGenerated > ago(30d)
//You can exclude guests if you want, they may be harder to move to more secure methods, comment out the below line to include all users
| where UserType == "Member"
| mv-expand todynamic(AuthenticationDetails)
| extend ['Authentication Method'] = tostring(AuthenticationDetails.authenticationMethod)
| where ['Authentication Method'] !in ("Previously satisfied", "Password", "Other")
| where isnotempty(['Authentication Method'])
| summarize
    ['Count of distinct MFA Methods']=dcount(['Authentication Method']),
    ['List of MFA Methods']=make_set(['Authentication Method'])
    by UserPrincipalName
//Find users with only one method found and it is text message
| where ['Count of distinct MFA Methods'] == 1 and ['List of MFA Methods'] has "text"
This example looks at each user that has used MFA to your Azure AD tenant. For each, it creates a set of different MFA methods used. For example, maybe they have used a push notification, a phone call and a text. They would have 3 methods in their set of methods. Now we add a final bit of logic. We find out where a user only has a single method, and that method is text. We can take this list and do some education with those users. Maybe show them how much easier a push notification is.
Use your data to help your users have a better experience
If you have onboarded data to Sentinel, or use Advanced Hunting, you can use that data to help your users out. While we aren’t measuring performance of computers or things like that, we can still get insights where they may be struggling.
Take for example Azure AD self service password reset. When a user goes through that workflow they can get stuck in a few spots, and we can find it. Each attempt at SSPR is linked by the same Correlation Id in Azure AD. So we can use that Id to make a list of actions that occurred during that attempt.
AuditLogs
| where LoggedByService == "Self-service Password Management"
| extend User = tostring(parse_json(tostring(InitiatedBy.user)).userPrincipalName)
| extend ['User IP Address'] = tostring(parse_json(tostring(InitiatedBy.user)).ipAddress)
| sort by TimeGenerated asc
| summarize ['SSPR Actions']=make_list(ResultReason) by CorrelationId, User, ['User IP Address']
If you have a look, you will see things like user submitted new password, maybe the password wasn’t strong enough. Hopefully a successful password reset at the end. Now if we want to help our users out we can dig into that data. For instance, we can see when a user tries to SSPR but doesn’t have an authentication method listed. We could reach out to them and help them get onboarded.
AuditLogs
| where LoggedByService == "Self-service Password Management"
| extend User = tostring(parse_json(tostring(InitiatedBy.user)).userPrincipalName)
| extend ['User IP Address'] = tostring(parse_json(tostring(InitiatedBy.user)).ipAddress)
| sort by TimeGenerated asc
| summarize ['SSPR Actions']=make_list(ResultReason) by CorrelationId, User, ['User IP Address']
| where ['SSPR Actions'] has "User's account has insufficient authentication methods defined. Add authentication info to resolve this"
| sort by User desc
If a user puts in a password that doesn’t pass complexity requirements we can see that too. We could query when the same user has tried 3 or more times to come up with a new password and is rejected. We all understand how frustrating that can be. They would definitely appreciate some help and you could maybe even use it as a change to move them to Windows Hello for Business, or passwordless. If you support those, of course.
AuditLogs
| where LoggedByService == "Self-service Password Management"
| extend User = tostring(parse_json(tostring(InitiatedBy.user)).userPrincipalName)
| extend ['User IP Address'] = tostring(parse_json(tostring(InitiatedBy.user)).ipAddress)
| sort by TimeGenerated asc
| summarize ['SSPR Actions']=make_list_if(ResultReason, ResultReason has "User submitted a new password") by CorrelationId, User, ['User IP Address']
| where array_length(['SSPR Actions']) >= 3
| sort by User desc
Consistent data is easy to read data
One of the hardest things about writing a query is just knowing where to look for those logs. The second hardest thing is dealing with data inconsistencies. If you have log data from many vendors, the data will be completely different. Maybe one firewall calls a reject a ‘deny’, another calls it ‘denied’, then your last firewall calls it ‘block’. They are the same in terms of what the firewall did. You have to account for the data differences though. If you don’t, you may miss results.
You can rename tables or even extend your own whenever you want. You can do that to unify your data, or just make it easier to read.
Say you have two pretend firewalls, one is a CheckPoint and one a Cisco. Maybe the CheckPoint shows the result as a column called ‘result’. The Cisco however uses ‘Outcome’.
You can simply rename one of them.
CheckPointLogs_CL
| project-rename Outcome=result
In our CheckPoint logs we have just told KQL to rename the ‘result’ field to ‘Outcome’
You can even do this as part of a ‘project’ at the end of your query if you want.
CheckPointLogs_CL
| project TimeGenerated, ['Source IP']=srcipv4, ['Destination IP']=dst_ipv4, Port=SrcPort, Outcome=result
We have renamed our fake columns to Source IP, Destination IP, Port, Outcome.
If we do the same for our Cisco logs, then our queries will be so much easier to write. Especially if you are joining between different data sets. They will also be much easier to read both for you and anyone else using them.
Be careful of case sensitivity
Remember that a number of string operators are KQL are case sensitive. There is a really useful table here that outlines the different combinations. Using a double equals sign in a query, such as UserPrincipalName == “reprise99@learnsentinel.com” is efficient. Remember though, that if my UserPrincipalName was reprise99@learnSentinel.com with a capital S, it wouldn’t return that result. It is a balancing act between efficiency and accuracy. If you are unsure about the consistency of your data, then stick with case insensitive operators. For example. UserPrincipalName =~ “reprise99@learnsentinel.com” would return results regardless of sensitivity.
This is also true for a not equals operator. != is case sensitive, and !~ is not.
You also have the ability to use either tolower() or toupper() to force a string to be one or the other.
tolower("RePRise99") == "reprise99"
toupper("RePRise99") == "REPRISE99"
This can help you make your results more consistent.
Use functions to save you time
If you follow my Twitter you know that I write a lot of functions. They are an amazing timesaver in KQL. Say you have written a really great query that tidies data up. Or one that combines a few data sources for you. Save it as function for next time.
My favourite functions are the ones that unify different data sources that are similar operations. Take adding or removing users to groups in Active Directory and Azure Active Directory. You may be interested in events from both environments. Unfortunately the data structure is completely different. Active Directory events come in via the SecurityEvent table. Whereas, Azure Active Directory events are logged to the AuditLogs table.
This function I wrote combines the two and unifies the data. So you can search for ‘add’ events, and it will bring back when users were added to groups in either environment. When you deploy this function you can easily create queries such as.
GroupChanges
| where GroupName =~ "Sentinel Test Group"
It will find groups named ‘Sentinel Test Group’ in either AD or AAD. It will return you who was added or removed, who did it and which environment the group belongs to. The actual KQL under the hood does all the hard work for you.
let aaduseradded=
    AuditLogs
    | where OperationName == "Add member to group"
    | extend Actor = tostring(parse_json(tostring(InitiatedBy.user)).userPrincipalName)
    | extend Target = tostring(TargetResources[0].userPrincipalName)
    | extend GroupName = tostring(parse_json(tostring(parse_json(tostring(TargetResources[0].modifiedProperties))[1].newValue)))
    | extend GroupID = tostring(parse_json(tostring(parse_json(tostring(TargetResources[0].modifiedProperties))[0].newValue)))
    | where isnotempty(Actor) and isnotempty(Target)
    | extend Environment = strcat("Azure Active Directory")
    | extend Action = strcat("Add")
    | project TimeGenerated, Action, Actor, Target, GroupName, GroupID, Environment;
let aaduserremoved=
    AuditLogs
    | where OperationName == "Remove member from group"
    | extend Actor = tostring(parse_json(tostring(InitiatedBy.user)).userPrincipalName)
    | extend GroupName = tostring(parse_json(tostring(parse_json(tostring(TargetResources[0].modifiedProperties))[1].oldValue)))
    | extend GroupID = tostring(parse_json(tostring(parse_json(tostring(TargetResources[0].modifiedProperties))[0].oldValue)))
    | extend Target = tostring(TargetResources[0].userPrincipalName)
    | where isnotempty(Actor) and isnotempty(Target)
    | extend Action = strcat("Remove")
    | extend Environment = strcat("Azure Active Directory")
    | project TimeGenerated, Action, Actor, Target, GroupName, GroupID, Environment;
let adchanges=
    SecurityEvent
    | project TimeGenerated, EventID, AccountType, MemberName, SubjectUserName, TargetUserName,TargetSid
    | where AccountType == "User"
    | where EventID in (4728, 4729, 4732, 4733, 4756, 4757)
    | parse MemberName with * 'CN=' Target ',OU=' *
    | extend Action = case(EventID in ("4728", "4756", "4732"), strcat("Add"),
        EventID in ("4729", "4757", "4733"), strcat("Remove"), "unknown")
    | extend Environment = strcat("Active Directory")
    | project
        TimeGenerated,
        Action,
        Actor=SubjectUserName,
        Target,
        GroupName=TargetUserName,
        GroupID =TargetSid,
        Environment;
union aaduseradded, aaduserremoved, adchanges
It may look complex, but it isn’t. We are just taking data that isn’t consistent and tidying it up. In AD when we add a user to a group, the group name is actually stored as ‘TargetUserName’ which isn’t very intuitive. So we rename it to GroupName, and we do the same for Azure AD. The Actor and Target are named different in AD and AAD, so let’s just rename them. Then we just add a new column for environment.
KQL isn’t just for Microsoft Sentinel
Not everyone has the budget to use Microsoft Sentinel, and I appreciate that. If you have access to Advanced Hunting you have access to an amazing amount of info there too. Especially if you have an Azure AD P2 license. The following data is available for you, at no additional cost to your existing Defender and Azure AD licensing.
- Device events – such as network or logon events.
- Email events – emails received or sent, attachment and URL info.
- Defender for Cloud Apps – all the logs from DCA and any connected apps.
- Alerts – all the alert info from other Defender products.
- Defender for Identity – if you use Defender for Identity, all that info is there.
- Azure AD Sign In Logs – if you have Azure AD P2 you get all the logon data. For both users and service principals.
The data structure between Sentinel and Advanced Hunting isn’t an exact match, but it is pretty close. Definitely get in there and have a look.
Visualize for impact
A picture is worth a thousand words. With all this data in your tenant you can use visualizations for all kinds of things. You can look for anomalies, try to find strange attack patterns. Of course they are good to report up to executives too. Executive summaries showing total email blocked, or credential attacks stopped always play well. When building visualizations, I want them to explain the data with no context needed. They should be straight forward and easy to understand.
A couple of examples I really think are valuable. The first shows you successful self service password reset and account unlock events. SSPR is such a great time saver for your helpdesk. It is also often more secure than a traditional password reset as the helpdesk can’t be socially engineered. It is also a great visualization to report upward. It is a time saver, and therefore money saver for your helpdesk, and it’s more secure. Big tick.
AuditLogs
| where TimeGenerated > ago (180d)
| where OperationName in ("Reset password (self-service)", "Unlock user account (self-service)")
| summarize
    ['Password Reset']=countif(OperationName == "Reset password (self-service)" and ResultDescription == "Successfully completed reset."),
    ['Account Unlock']=countif(OperationName == "Unlock user account (self-service)" and ResultDescription == "Success")
    by startofweek(TimeGenerated)
| render timechart
    with (
    ytitle="Count",
    xtitle="Day",
    title="Self Service Password Resets and Account Unlocks over time")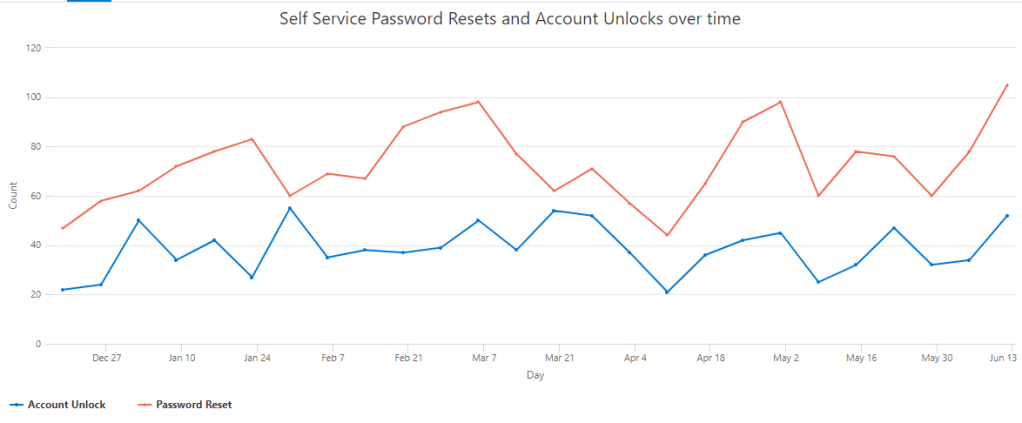
With KQL we can even rename our axis and title in the query, copy and paste the picture. Send it to your boss, show him how amazing you are. Get a pay increase.
And a similar query, showing password vs passwordless sign ins into your tenant. Maybe your boss has heard of passwordless, or zero trust. Show him how you are tracking to help drive change.
SigninLogs
| where TimeGenerated > ago (180d)
| mv-expand todynamic(AuthenticationDetails)
| project TimeGenerated, AuthenticationDetails
| extend AuthMethod = tostring(AuthenticationDetails.authenticationMethod)
| summarize
    Passwordless=countif(AuthMethod in ("Windows Hello for Business", "Passwordless phone sign-in", "FIDO2 security key", "X.509 Certificate")),
    Password=countif(AuthMethod == "Password")
    by bin(TimeGenerated, 1d)
| render timechart with (title="Passwordless vs Password Authentication", ytitle="Count")
Don’t be afraid of making mistakes or writing ‘bad’ queries
For normal logs in Sentinel, there is no cost to run a query. For Advanced Hunting, there is no cost to query. Your licensing and ingestion fees give you the right to try as much as you want. If you can’t find what you are looking for, then start broadly. You can search across all your data easily.
search "reprise99"It may take a while, but you will get hits. Then find out what tables they are in. Then narrow down your query. I think of writing queries like a funnel. Start broad, then get more specific until you are happy with it.
In my day to day work and putting together 365 queries to share, I have run just under 60,000 queries in Sentinel itself. Probably another 10,000 or more in Advanced Hunting. A lot of them would have caused errors initially. That is how you will learn! Like anything, practice makes progress.
As I transition to a new role I will keep sharing KQL and other security resources that are hopefully helpful to people. The feedback I have had from everyone has been amazing. So I appreciate you reading and following along.
This was how many queries I ran per day this year!


I really appreciate the queries and examples you provide on your posts it helps a lot
LikeLike
1 Pingback