
One of the lesser known and more interesting operators that you can use with KQL is series_decompose_anomalies. When you first read the Microsoft article it is a little intimidating to be honest but thankfully there is a community post here that explains it quite well. Essentially, we can use the series_decompose_anomalies operator to look for anomalies in time series data. We can use the various aggregation functions in KQL to turn our log data into time series data. The structure of these queries are all similar, we want to create some parameters to use in our query, build our time series data, then look for anomalies within it. Then finally we want to make some sense of those anomalies by applying them to our raw log data and optionally visualize the anomalies. Easy!
Let’s use Azure AD sign in logs as a first example, there is a good chance you have plenty of data in your tenant and the logs come with plenty of information. We will try and find some anomalies in the amount of a few error codes. Start by creating some parameters to use throughout the query.
let starttime = 7d;
let timeframe = 1h;
let resultcodes = dynamic(["50126","53003","50105"]);
So we are going to look at the last 7 days of data, break it down into one hour blocks and look for 3 particular error codes which are 50126 (wrong username and password), 53003 (access blocked by conditional access) and 50105 (user signed in correctly but doesn’t have access to the resource). So let’s run the query to look for those, and then make a time series dataset from the results using the make-series operator.
let starttime = 7d;
let timeframe = 1h;
let resultcodes = dynamic(["50126","53003","50105"]);
SigninLogs
| where TimeGenerated > ago(starttime)
| where ResultType in (resultcodes)
| project TimeGenerated, UserPrincipalName, ResultType, AppDisplayName, Location
| order by TimeGenerated
| summarize Events=count()by UserPrincipalName, bin(TimeGenerated, timeframe)
| summarize EventCount=make_list(Events),TimeGenerated=make_list(TimeGenerated) by UserPrincipalName
You should be left with three columns, all the one hour time blocks, how many events in each block and the userprincipalname.
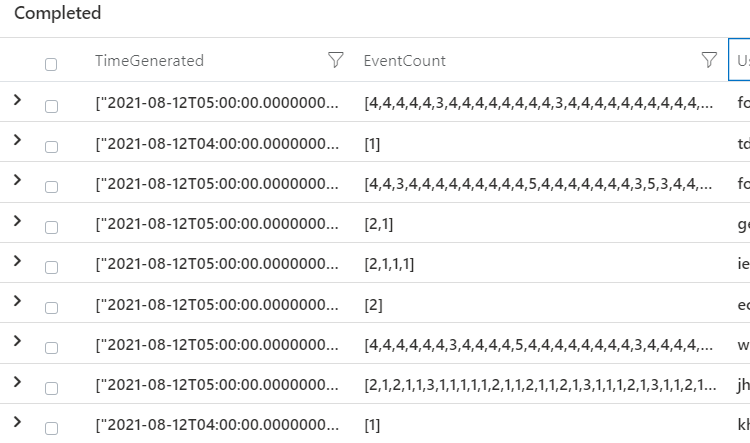
Now we are going to use our series_decompose_anomalies operator to find anomalies in the data set.
let starttime = 7d;
let timeframe = 1h;
let resultcodes = dynamic(["50126","53003","50105"]);
SigninLogs
| where TimeGenerated > ago(starttime)
| where ResultType in (resultcodes)
| project TimeGenerated, UserPrincipalName, ResultType, AppDisplayName, Location
| order by TimeGenerated
| summarize Events=count()by UserPrincipalName, bin(TimeGenerated, timeframe)
| summarize EventCount=make_list(Events),TimeGenerated=make_list(TimeGenerated) by UserPrincipalName
| extend outliers=series_decompose_anomalies(EventCount)
We can see that we get some hits on 1 (more events than expected), -1 (less than expected) and lots of 0 (as expected).

It retains all the outliers in a single series, but we want to use the mv-expand operator to get our outliers as a single row, and for this case we are only interested where outliers = 1 (more events than expected)
let starttime = 30d;
let timeframe = 1h;
let resultcodes = dynamic(["50126","53003","50105"]);
SigninLogs
| where TimeGenerated > ago(starttime)
| where ResultType in (resultcodes)
| project TimeGenerated, UserPrincipalName, ResultType, AppDisplayName, Location
| make-series totalevents = count()on TimeGenerated from ago(starttime) step timeframe by ResultType
| extend outliers=series_decompose_anomalies(totalevents)
| mv-expand TimeGenerated, totalevents, outliers
| where outliers == 1
Which will give us an output showing which hour had the increase, how many events in that hour and the userprincipalname.

Now the key is making some sense of this data; to do that we are actually going to take the results of our query and cast it as a variable, then run it back through our sign in data to pull out information that is useful. So we can call our first query ‘outlierusers’ and we are only interested in grabbing each username once. We know this account has been flagged with our query, so we use the distinct operator to only retrieve it a single time.
let starttime = 7d;
let timeframe = 1h;
let resultcodes = dynamic(["50126","53003","50105"]);
let outlierusers=
SigninLogs
| where TimeGenerated > ago(starttime)
| where ResultType in (resultcodes)
| project TimeGenerated, UserPrincipalName, ResultType, AppDisplayName, Location
| order by TimeGenerated
| summarize Events=count()by UserPrincipalName, bin(TimeGenerated, timeframe)
| summarize EventCount=make_list(Events),TimeGenerated=make_list(TimeGenerated) by UserPrincipalName
| extend outliers=series_decompose_anomalies(EventCount)
| mv-expand TimeGenerated, EventCount, outliers
| where outliers == 1
| distinct UserPrincipalName;
Then we use our first query as a variable to our second and get a visualization of our outlier users – | where UserPrincipalName in (outlierusers). You can keep either the same time frame for the second part of your query, or make it different. You could look for 7 days of data to detect your anomalies and then hunt just the last day for your more detailed information. In this example we will keep the same, 7 days in 1 hour blocks.
let starttime = 7d;
let timeframe = 1h;
let resultcodes = dynamic(["50126","53003","50105"]);
let outlierusers=
SigninLogs
| where TimeGenerated > ago(starttime)
| where ResultType in (resultcodes)
| project TimeGenerated, UserPrincipalName, ResultType, AppDisplayName, Location
| order by TimeGenerated
| summarize Events=count()by UserPrincipalName, bin(TimeGenerated, timeframe)
| summarize EventCount=make_list(Events),TimeGenerated=make_list(TimeGenerated) by UserPrincipalName
| extend outliers=series_decompose_anomalies(EventCount)
| mv-expand TimeGenerated, EventCount, outliers
| where outliers == 1
| distinct UserPrincipalName;
SigninLogs
| where TimeGenerated > ago(starttime)
| where UserPrincipalName in (outlierusers)
| where ResultType != 0
| summarize LogonCount=count() by UserPrincipalName, bin(TimeGenerated, timeframe)
| render timechart 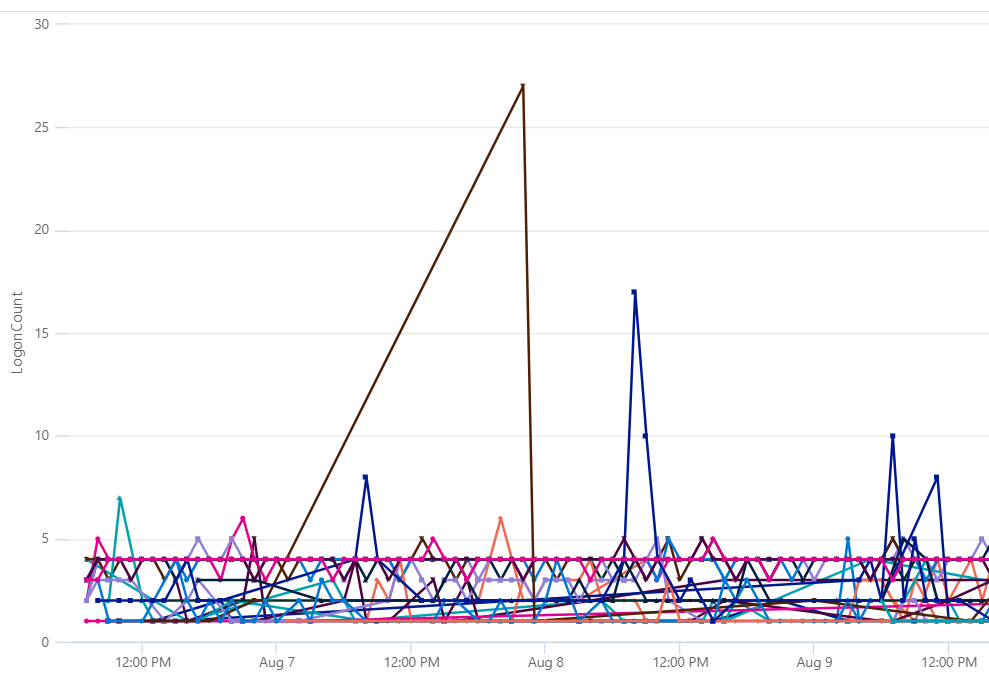
So we end up with a time chart showing the users, and the hour blocks where the anomaly detection occurred.
So to recap for each query we want to
- Set parameters
- Build a time series
- Detect anomalies
- Apply that to a broader data set to enrich your alerting
Another example, let’s search the OfficeActivity table for download events, hunt for the anomalies, then use that data to track down the users last logged on machine and retrieve all USB file copy events.
let starttime = 7d;
let timeframe = 30m;
let operations = dynamic(["FileSyncDownloadedFull","FileDownloaded"]);
let outlierusers=
OfficeActivity
| where TimeGenerated > ago(starttime)
| where Operation in (['operations'])
| extend UserPrincipalName = UserId
| project TimeGenerated, UserPrincipalName
| order by TimeGenerated
| summarize Events=count()by UserPrincipalName, bin(TimeGenerated, timeframe)
| summarize EventCount=make_list(Events),TimeGenerated=make_list(TimeGenerated) by UserPrincipalName
| extend outliers=series_decompose_anomalies(EventCount)
| mv-expand TimeGenerated, EventCount, outliers
| where outliers == 1
| distinct UserPrincipalName;
let id=
IdentityInfo
| where AccountUPN in (outlierusers)
| where TimeGenerated > ago (21d)
| summarize arg_max(TimeGenerated, *) by AccountName
| extend LoggedOnUser = AccountName
| project LoggedOnUser, AccountUPN, JobTitle, EmployeeId, Country, City
| join kind=inner (
DeviceInfo
| where TimeGenerated > ago (21d)
| summarize arg_max(TimeGenerated, *) by DeviceName
| extend LoggedOnUser = tostring(LoggedOnUsers[0].UserName)
) on LoggedOnUser
| project LoggedOnUser, AccountUPN, JobTitle, Country, DeviceName, EmployeeId;
DeviceEvents
| where TimeGenerated > ago(7d)
| join kind=inner id on DeviceName
| where ActionType == "UsbDriveMounted"
| extend DriveLetter = tostring(todynamic(AdditionalFields).DriveLetter)
| join kind=inner (DeviceFileEvents
| where TimeGenerated > ago(7d)
| extend FileCopyTime = TimeGenerated
| where ActionType == "FileCreated"
| parse FolderPath with DriveLetter '\\' *
| extend DriveLetter = tostring(DriveLetter)
) on DeviceId, DriveLetter
| extend FileCopied = FileName1
| distinct DeviceName, DriveLetter, FileCopied, LoggedOnUser, AccountUPN, JobTitle, EmployeeId, Country
You will be returned a list of file USB file creation activities for each user who had higher than expected Office download actions.
Want to check whether you have had a sharp increase in syslog activity from certain machines?
let starttime = 5d;
let timeframe = 30m;
let Computers=Syslog
| where TimeGenerated >= ago(starttime)
| summarize EventCount=count() by Computer, bin(TimeGenerated,timeframe)
| where EventCount > 1500
| order by TimeGenerated
| summarize EventCount=make_list(EventCount),TimeGenerated=make_list(TimeGenerated) by Computer
| extend outliers=series_decompose_anomalies(EventCount,2)
| mv-expand TimeGenerated, EventCount, outliers
| where outliers == 1
| distinct Computer
;
Syslog
| where TimeGenerated >= ago(starttime)
| where Computer in (Computers)
| summarize EventCount=count() by Computer, bin(TimeGenerated, timeframe)
| render timechart 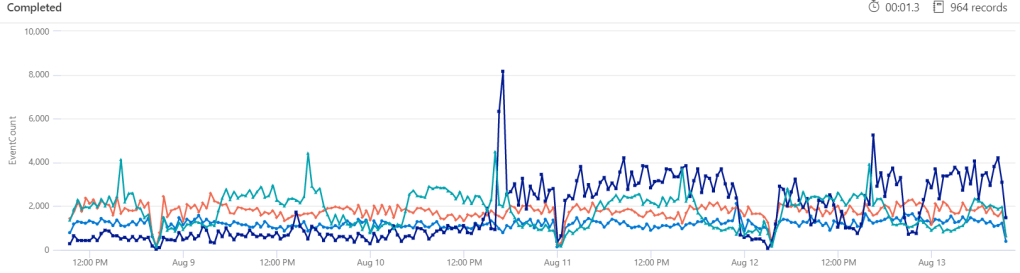
In this query we have also increased the detection threshold from the default 1.5 to 2 with | extend outliers=series_decompose_anomalies(EventCount,2). We have also excluded machines with less than 1500 events per 30 minutes with | where EventCount > 1500. Maybe we don’t care if an anomaly is detected until it goes over that threshold. That is where you will need to combine the smarts of Azure Sentinel and KQL with your knowledge of your environment; what Sentinel things is strange may be normal to you. So spend some time making sure the first three steps are sound – your parameters, your time series and what you consider anomalous to your specific environment.
There are a heap of great queries on the official GitHub here and I have started to upload any useful queries to my own.

One thought on “Detecting anomalies unique to your environment with Azure Sentinel”
1 Pingback