Microsoft Sentinel 101

Learning Microsoft Sentinel, one KQL error at a time

Using Logic Apps to version control your Azure AD Conditional Access Policies — 4th Oct 2021

Using Logic Apps to version control your Azure AD Conditional Access Policies

Azure AD Conditional Access is a fantastic tool, anyone using Azure AD as an identity provider is probably familiar with it, unfortunately like a lot of Azure AD there is no native version control though, so if you change or remove a policy there is no way to roll back. You can manage conditional access entirely through code but you may not be at that level of maturity and just want a backup available should policies be changed accidentally or maliciously.

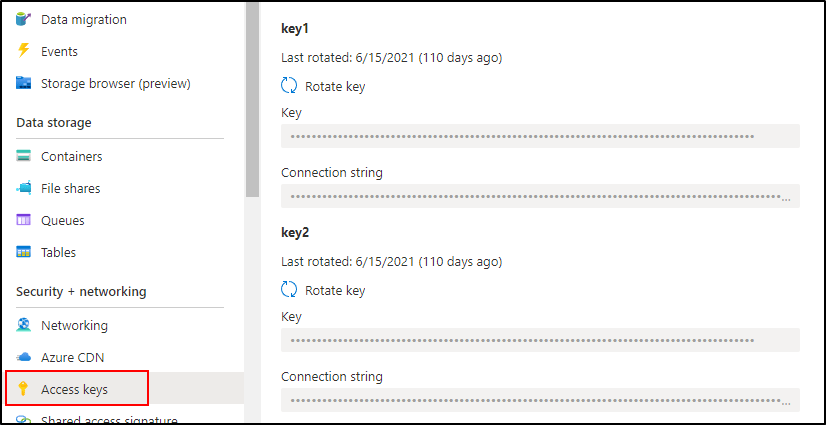
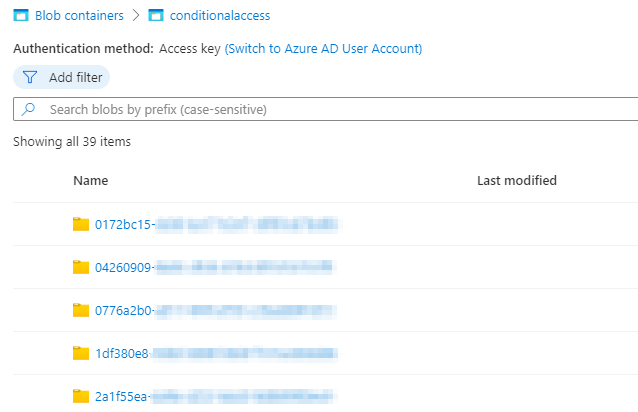
In this example we will use Azure Sentinel to detect any new policies being created, policies being updated or policies being deleted and then store the changes in an Azure storage account. First you will need to either create a storage account or use an existing, and then create a container (folder) for your policies, I have just called mine ‘conditionalaccess’. Grab an access key for the account, we will need it in Logic Apps soon.

Your Logic App will need two sets of credentials, first an account (or Azure AD application) with enough access to read Conditional Access policies, and second the Azure Storage access key from above to write to your storage location.

Our first Logic App is just going to download all our policies from Microsoft Graph and put them into our storage account. Azure Sentinel will take over when it starts alerting on new policies, or changes and deletions, but we need to grab the current state. We could do this via PowerShell or a number of other ways, but instead we will just create a Logic App we run once – that way it will be a consistent format when we use Sentinel. Create a Logic App with recurrence as the trigger (set it to 3 months or something), hopefully this doesn’t take you that long! Our entire Logic App will look this this when done.

The first 6 steps of this are to connect to Microsoft Graph to retrieve a token for re-use. Check out this post for how to post to the Microsoft Graph to retrieve an access token. To give a little more detail to the last five steps, we first want to list the ids of our existing policies. We do that by performing a GET action on the conditionalAccess endpoint and selecting only the id.

Then the next few steps we just need to manipulate our data a little to get it into a format so we can iterate through an array and get the details of all our policies.

First we parse the JSON response from Microsoft Graph using the following schema.

{
    "properties": {
        "@@odata.context": {
            "type": "string"
        },
        "value": {
            "items": {
                "properties": {
                    "id": {
                        "type": "string"
                    }
                },
                "required": [
                    "id"
                ],
                "type": "object"
            },
            "type": "array"
        }
    },
    "type": "object"
}

Then we create an array from our list of ids using the createArray function

{
    "inputs": "@createArray(body('Parse_JSON')?['value'])"
}

Then just parse the array so we can loop through it using the following schema.

{
    "items": {
        "items": {
            "properties": {
                "id": {
                    "type": "string"
                }
            },
            "required": [
                "id"
            ],
            "type": "object"
        },
        "type": "array"
    },
    "type": "array"
}

Then finally, we are going to grab each id we pulled from Microsoft Graph, get the details of the policy (using our access token as authorization) and create a blob in our storage. When you first use the Azure Blob Storage connector you will just need to use the access key from earlier.

Then trigger your Logic App and in your storage account you should see a list of containers with your policy ids and then a json file in each with the current config.

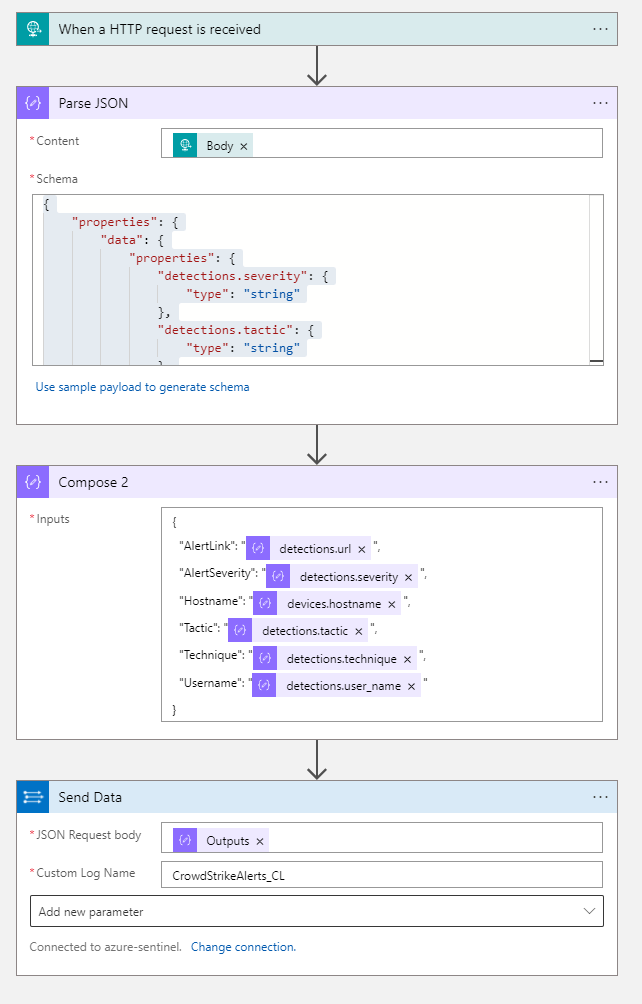
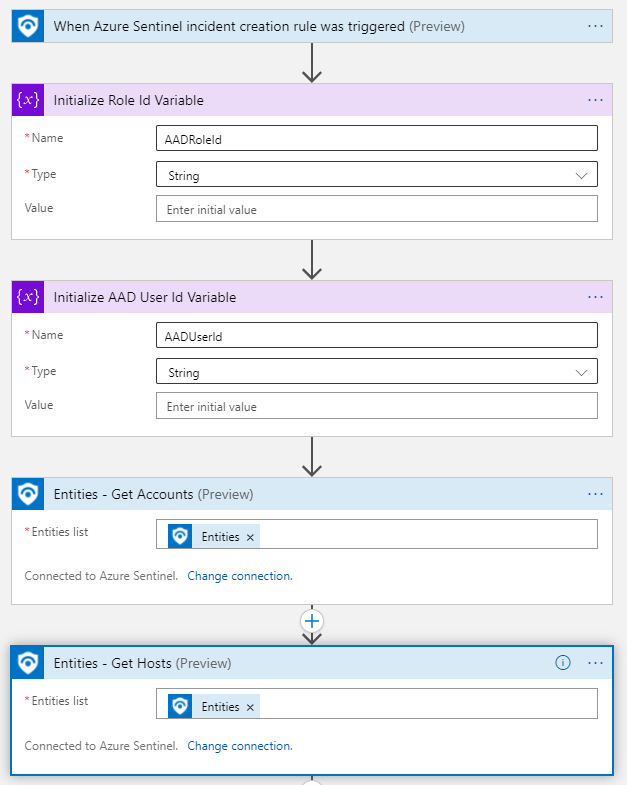
Now, we have done all that hard work we can disable or even delete that Logic App, because we will build a new one that will keep our storage up to date when changes occur to conditional access. So create a new Logic App, this time though our trigger will be an Azure Sentinel alert. We will retrieve our account entities from the alert which we are going to use further on – we will use the entity mapping to get the operation name and the id of the policy that was changed so we know what action to take. The next few steps are exactly the same as before, post to Microsoft Graph to get a token for re-use.

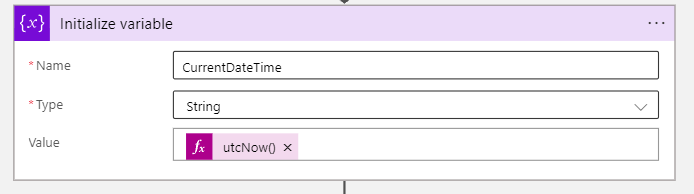
We will just rename our variables to ConditionalAccessOperation and ConditionalAccessID to make it clearer, rather than using the account mapping names. Then just create a variable called CurrentDateTime using the utcNow() function, we will use this to timestamp our changes.

Then the final part we will use a control condition called ‘Switch’ where we complete different actions depending on the operation type, so for a new policy created we will do one action, for an update a different action, and for a delete a different action.

So for adding an new conditional access policy we will retrieve it from Microsoft Graph, then add a new container based on the id and a new json file with the initial policy.

For an update, it is much the same except we will add a file with the updated policy

And finally for a delete action we will just add a text file with the time stamp when it was deleted, we can’t query Microsoft Graph anymore because the policy is gone.

Your Logic App should look like this (linked for big)

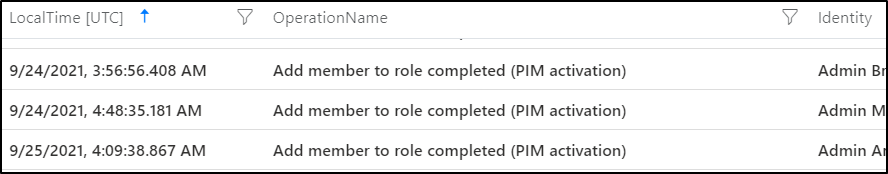
Lastly, we just need to get Azure Sentinel to detect on any of these changes, so create a new analytics rule, with the following query.

AuditLogs
| where OperationName contains "conditional access policy"
| extend ConditionalAccessID = tostring(TargetResources[0].id)
| sort by TimeGenerated desc 
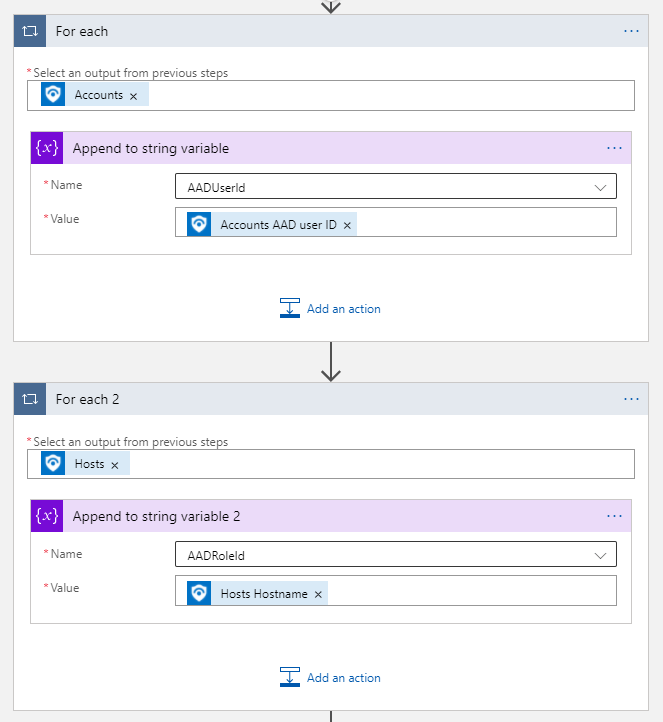
| project OperationName, ConditionalAccessID

Set it to run every 5 minutes, looking at the last 5 minutes of data and trigger an alert for each event (in case multiple policies are changed). For entity mappings, map them to account name and AAD User ID so that our Logic App flows properly when it is triggered.

Finally on the automated response tab under ‘Alert automation’ select the Logic App you just built. Now if you perform any of those actions you should see a lifecycle of a policy in its respective folder.

Just a couple of points-

  • Sentinel can only run every 5 minutes to search for alerts, even though it can trigger multiple times within that window. If a policy is changed, then changed again in 5 minutes when the Logic App runs it will just grab the latest update/current version.
  • If a policy is changed then deleted within 5 minutes then the changes before deletion won’t be available, because when the Logic App goes to retrieve the changes from Microsoft Graph the policy would have already been removed.

These are a couple of small trade offs to have a very inexpensive Logic App and a tiny amount of storage to backup your hard work though.

Using time to your advantage in Azure Sentinel — 1st Oct 2021

Using time to your advantage in Azure Sentinel

Adversary hunting would be a lot easier if we were always looking for a single event that we knew was malicious, but unfortunately that isn’t always the case. Often when hunting for threats, a combination of events over a certain time period may be added cause for concern, or events happening at certain times of the day are more suspicious to you. Take for example a user setting up a mail forward in Outlook, that may not be inherently suspicious on its own but if it happened not too long after an abnormal sign on, then that would certainly increase the severity. Perhaps particular administrative actions outside of normal business hours would be an indicator of compromise.

Azure Sentinel and KQL have an array of really great operators to help you manipulate and tune your queries to leverage time as an added resource when hunting. We can use logic such as hunting for activities before and after a particular event, look for actions only after an event, or even calculate the time between particular events, and use that as a signal. Some of the operators worth getting familiar with are – ago, between and timespan.

I always try to remember this graphic when writing queries, Azure Sentinel/Log Analytics is highly optimized for log data, so the quicker you can filter down to the time period you care about, the faster your results will be. Searching all your data for a particular event, then filtering down to the last day will be significantly slower than filtering your data to the last day, then finding your particular event.

We often forget in Sentinel/KQL that we can apply where causes to time in the same way we would any other data, such as usernames, event ids, error codes or any other string data. You have probably written a thousand queries that start with something similar to this –

Sometable
| where TimeGenerated > ago (2h)

But you can filter your time data even before writing the rest of your queries, maybe you want to look at 7 days of data, but only between midnight and 4am. So first take 7 days of data, then slice out the 4 hours you care about.

Sometable
| where TimeGenerated > ago (7d)
| where hourofday( TimeGenerated ) between (0 .. 3)

If you want to exclude instead of include particular hours then you can use !between.

Perhaps you are interested in admin staff who have activated Azure AD PIM roles after hours, using KQL we can leverage the hourofday function to query only between particular hours. Remember that by default Sentinel will query on UTC time, so extend a column first to create a time zone that makes sense to you. The below query will find any PIM activations that aren’t between 5am and 8pm in UTC+5.

AuditLogs
| extend LocalTime=TimeGenerated+5h
| where hourofday( LocalTime) !between (5 .. 19)
| where OperationName == "Add member to role completed (PIM activation)"

If we take our example from the start of the post, we can detect when a user is flagged for a suspicious logon, in this case via Azure AD Identity Protection, and then within two hours created a mail forward in Office 365. This behaviour is often seen by attackers hoping to exfiltrate data or maintain a foothold in your environment.

SecurityAlert
| where ProviderName == "IPC"
| project AlertTime=TimeGenerated, CompromisedEntity
| join kind=inner 
(
OfficeActivity
| extend ForwardTime=TimeGenerated
) on $left.CompromisedEntity == $right.UserId
| where Operation == "Set-Mailbox"
| where Parameters contains "DeliverToMailboxAndForward"
| extend TimeDelta = abs(ForwardTime - TimeGenerated)
| where TimeDelta < 2h
| project AlertTime, ForwardTime, CompromisedEntity 

For this query we take the time the alert was generated, rename it to AlertTime, and the userprincipalname of the compromised entity, join it to our OfficeActivity table looking for mail forward creation events. Then finally we use the abs operator to calculate the time between the forward creation and the identity protection alert and only flag when it is less than 2 hours. There are many ways to create forwards in Outlook (such as via mailbox rules), this is just showing one particular method, but the example is more to drive the use of time as a detection method than being all encompassing.

We can also use a particular event as a starting point, then retrieve data from either side of that event. Say a user triggers an ‘unfamiliar sign-in properties’ event. We can use the time of that alert as an anchor point, and retrieve the 60 minutes of sign in data either side of the alert to give us some really great context. We do this by using a combination of the between and timespan operators

SecurityAlert
| where AlertName == "Unfamiliar sign-in properties"
| project AlertTime=TimeGenerated, UserPrincipalName=CompromisedEntity
| join kind=inner 
(
SigninLogs
) on UserPrincipalName
| where TimeGenerated between ((AlertTime-timespan(60m)).. (AlertTime+timespan(60m)))
| project UserPrincipalName, SigninTime=TimeGenerated, AlertTime, AppDisplayName, ResultType, UserAgent, IPAddress, Location

We can see both the events prior to and those after the alert time.

You can use these time operators with much more detailed hunting too, if you use the anomaly detection operators, you can tune your detections to only parts of the day. Taking the example from that post, maybe we are interested in particular failed sign in activities, but only in non regular working hours.

let starttime = 7d;
let timeframe = 1h;
let resultcodes = dynamic(["50126","53003","50105"]);
let outlierusers=
SigninLogs
| where TimeGenerated > ago(starttime)
| where hourofday( TimeGenerated) !between (6 .. 18)
| where ResultType in (resultcodes)
| project TimeGenerated, UserPrincipalName, ResultType, AppDisplayName, Location
| order by TimeGenerated
| summarize Events=count()by UserPrincipalName, bin(TimeGenerated, timeframe)
| summarize EventCount=make_list(Events),TimeGenerated=make_list(TimeGenerated) by UserPrincipalName
| extend outliers=series_decompose_anomalies(EventCount)
| mv-expand TimeGenerated, EventCount, outliers
| where outliers == 1
| distinct UserPrincipalName;
SigninLogs
| where TimeGenerated > ago(starttime)
| where UserPrincipalName in (outlierusers)
| where ResultType != 0
| summarize LogonCount=count() by UserPrincipalName, bin(TimeGenerated, timeframe)
| render timechart 

I have some more examples of similar alerts in my GitHub repo, such as Azure Key Vault access manipulation.

Protecting Azure Key Vault with Azure Sentinel — 9th Sep 2021

Protecting Azure Key Vault with Azure Sentinel

Azure Key Vault is Microsoft’s cloud vault which you can use to store secrets and passwords, API keys or certificates. If you do any kind of automation with Azure Functions, or Logic Apps or any scripting more broadly in Azure then there is a good chance you use a Key Vault, its authentication and role based access is tied directly into Azure Active Directory. When we talk about Azure Key Vault security, we can group it into three categories –

  • Network Security – this is pretty straight forward, which networks can access your Key Vault.
  • Management Plane Security – the management plane is where you manage the Key Vault itself, so changing settings, or generating secrets, or updating access policies. Management plane security is controlled by Azure RBAC.
  • Data Plane Security – data plane security is the security of the data within the Key Vault, so accessing, editing or deleting secrets, keys and certificates.

Firstly, make sure you are sending diagnostic logs to Azure Sentinel which you can do on the ‘Diagnostics setting’ tab on a Key Vault, or more uniformly across all your Key Vaults through Azure Policy or Azure Security Center. Events get sent to the AzureDiagnostics table in Azure Sentinel. This table can be tricky to make your way around – because so many various Azure services send logs to it, each with varying data structures, you will notice a lot of columns will only exist for specific actions.

Let’s first look at network security, Key Vault networking isn’t too difficult to get a handle on thankfully. A Key Vault can be accessed either from anywhere on the internet or from a list of specifically allowed IP addresses and/or private endpoints. If your security stance is that Key Vaults are only to be accessed over an allowed list of IP addresses or private endpoints then you can detect when the policy is changed to allow all by default.

// Detects when an Azure Key Vault firewall is set to allow all by default
AzureDiagnostics
| where ResourceType == "VAULTS"
| where OperationName == "VaultPatch"
| where ResultType == "Success"
| project-rename ExistingACL=properties_networkAcls_defaultAction_s, VaultName=Resource
| where isnotempty(ExistingACL)
| where ExistingACL == "Deny"
| sort by TimeGenerated desc  
| project
    TimeGenerated,
    SubscriptionId,
    VaultName,
    ExistingACL
| join kind=inner
(
AzureDiagnostics
| project-rename NewACL=properties_networkAcls_defaultAction_s, VaultName=Resource
| where ResourceType == "VAULTS"
| where OperationName == "VaultPatch"
| where ResultType == "Success"
| summarize arg_max(TimeGenerated, *) by VaultName, NewACL
) 
on VaultName
| where ExistingACL != NewACL and NewACL == "Allow"
| project DetectionTime=TimeGenerated1, VaultName, ExistingACL, NewACL, SubscriptionId, IPAddressofActor=CallerIPAddress, Actor=identity_claim_http_schemas_xmlsoap_org_ws_2005_05_identity_claims_upn_s

We can see the ACL on the Key Vault firewall has flipped from Deny to Allow. Just a note about the AzureDiagnostics table, if the current ACL is set to ‘Deny’ and you complete other actions (maybe adding a secret, or changing some other settings) on the Key Vault, then that field will keep showing as ‘Deny’ on every action and every log, it doesn’t appear only when making changes to the firewall. So when we join the table in our query we look for when the ACL column has changed and the most recent record (using arg_max) is ‘Allow’.

If you have an approved group of IP ranges you allow, such as your corporate locations, you can also detect for ranges added over and above that in a similar way. This could be an adversary trying to maintain access to a Key Vault they have accessed, or a staff member circumventing policy.

// Detects when an IP address has been added to an Azure Key Vault firewall allow list
AzureDiagnostics
| where ResourceType == "VAULTS"
| where OperationName == "VaultPatch"
| where ResultType == "Success"
| where isnotempty(addedIpRule_Value_s)
| project
    TimeGenerated,
    VaultName=Resource,
    SubscriptionId,
    IPAddressofActor=CallerIPAddress,
    Actor=identity_claim_http_schemas_xmlsoap_org_ws_2005_05_identity_claims_upn_s,
    IPRangeAdded=addedIpRule_Value_s

With this detection, we aren’t changing a global firewall rule i.e. from Deny to Allow, but instead adding new ranges to an existing allow list, so we can return the new IP range that was added in our query.

For management plane security; general access to your Key Vault is going to controlled more broadly by Azure RBAC, so anyone with sufficient privilege in management groups, subscriptions, resource groups or on the Key Vault itself will be able to read or change settings – how that is controlled will be completely unique to your environment. A valuable detection in Sentinel is finding any changes to Azure Key Vault access policies however. An access policy defines what operations service principals (users, app registrations or groups) can perform on secrets, keys or certificates stored in your Key Vault. For instance you may have one set of users who can read and list secrets, but not update them, while others have additional access. The following query finds additions to those access policies.

// Detects when a service principal (user, group or app) has been granted access to Key Vault data
AzureDiagnostics
| where ResourceType == "VAULTS"
| where OperationName == "VaultPatch"
| where ResultType == "Success"
| project-rename ServicePrincipalAdded=addedAccessPolicy_ObjectId_g, Actor=identity_claim_http_schemas_xmlsoap_org_ws_2005_05_identity_claims_name_s, AddedKeyPolicy = addedAccessPolicy_Permissions_keys_s, AddedSecretPolicy = addedAccessPolicy_Permissions_secrets_s,AddedCertPolicy = addedAccessPolicy_Permissions_certificates_s
| where isnotempty(AddedKeyPolicy)
    or isnotempty(AddedSecretPolicy)
    or isnotempty(AddedCertPolicy)
| project
    TimeGenerated,
    KeyVaultName=Resource,
    ServicePrincipalAdded,
    Actor,
    IPAddressofActor=CallerIPAddress,
    AddedSecretPolicy,
    AddedKeyPolicy,
    AddedCertPolicy

We can also use some more advanced hunting techniques and detect when access was added then removed within a brief period, this may be a sign of an adversary accessing a Key Vault, retrieving the information and then covering their tracks. This is example shows when access was added then removed from a Key Vault within 10 minutes and returns the access changes.

 AzureDiagnostics
| where ResourceType == "VAULTS"
| where OperationName == "VaultPatch"
| where ResultType == "Success"
| extend UserObjectAdded = addedAccessPolicy_ObjectId_g
| extend AddedActor = identity_claim_http_schemas_xmlsoap_org_ws_2005_05_identity_claims_upn_s
| extend KeyAccessAdded = tostring(addedAccessPolicy_Permissions_keys_s)
| extend SecretAccessAdded = tostring(addedAccessPolicy_Permissions_secrets_s)
| extend CertAccessAdded = tostring(addedAccessPolicy_Permissions_certificates_s)
| where isnotempty(UserObjectAdded)
| project
    AccessAddedTime=TimeGenerated,
    ResourceType,
    OperationName,
    ResultType,
    KeyVaultName=Resource,
    AddedActor,
    UserObjectAdded,
    KeyAccessAdded,
    SecretAccessAdded,
    CertAccessAdded
| join kind=inner 
    ( 
    AzureDiagnostics
    | where ResourceType == "VAULTS"
    | where OperationName == "VaultPatch"
    | where ResultType == "Success"
    | extend RemovedActor = identity_claim_http_schemas_xmlsoap_org_ws_2005_05_identity_claims_upn_s
    | extend UserObjectRemoved = removedAccessPolicy_ObjectId_g
    | extend KeyAccessRemoved = tostring(removedAccessPolicy_Permissions_keys_s)
    | extend SecretAccessRemoved = tostring(removedAccessPolicy_Permissions_secrets_s)
    | extend CertAccessRemoved = tostring(removedAccessPolicy_Permissions_certificates_s)
    | where isnotempty(UserObjectRemoved)
    | project
        AccessRemovedTime=TimeGenerated,
        ResourceType,
        OperationName,
        ResultType,
        KeyVaultName=Resource,
        RemovedActor,
        UserObjectRemoved,
        KeyAccessRemoved,
        SecretAccessRemoved,
        CertAccessRemoved
    )
    on KeyVaultName
| extend TimeDelta = abs(AccessAddedTime - AccessRemovedTime)
| where TimeDelta < 10m
| project
    KeyVaultName,
    AccessAddedTime,
    AddedActor,
    UserObjectAdded,
    KeyAccessAdded,
    SecretAccessAdded,
    CertAccessAdded,
    AccessRemovedTime,
    RemovedActor,
    UserObjectRemoved,
    KeyAccessRemoved,
    SecretAccessRemoved,
    CertAccessRemoved,
    TimeDelta

So we have covered network access and management plane access and now we can have a look at possible threats in data plane actions. Each time an action occurs against a key, secret or certificate it is logged to the same AzureDiagnostics table. The most common action will be a retrieval of a current item, but deletions or purges or updates are all logged as well. Over time we can build up a baseline of what is normal access for a Key Vault looks like and then alert for actions outside of that. The below query looks back over 30 days, then compares that to the last day and detects for any new users accessing a Key Vault. Then it also retrieves all the actions taken by that user in the last day.

//Searches for access by users who have not previously accessed an Azure Key Vault in the last 30 days and returns all actions by those users
let operationlist = dynamic(["SecretGet", "KeyGet", "VaultGet"]);
let starttime = 30d;
let endtime = 1d;
let detection=
    AzureDiagnostics
    | where TimeGenerated between (ago(starttime) .. ago(endtime))
    | where ResourceType == "VAULTS"
    | where ResultType == "Success"
    | where OperationName in (operationlist)
    | where isnotempty(identity_claim_http_schemas_xmlsoap_org_ws_2005_05_identity_claims_upn_s)
    | project-rename KeyVaultName=Resource, UserPrincipalName=identity_claim_appid_g
    | distinct KeyVaultName, UserPrincipalName
    | join kind=rightanti  (
        AzureDiagnostics
        | where TimeGenerated > ago(endtime)
        | where ResourceType == "VAULTS"
        | where ResultType == "Success"
        | where OperationName in (operationlist)
        | where isnotempty(identity_claim_http_schemas_xmlsoap_org_ws_2005_05_identity_claims_upn_s)
        | project-rename
            KeyVaultName=Resource,
            UserPrincipalName=identity_claim_http_schemas_xmlsoap_org_ws_2005_05_identity_claims_upn_s
        | distinct KeyVaultName, UserPrincipalName)
        on KeyVaultName, UserPrincipalName;
AzureDiagnostics
| where TimeGenerated > ago(endtime)
| where ResourceType == "VAULTS"
| where ResultType == "Success"
| project-rename
    KeyVaultName=Resource,
    UserPrincipalName=identity_claim_http_schemas_xmlsoap_org_ws_2005_05_identity_claims_upn_s
| join kind=inner detection on KeyVaultName, UserPrincipalName
| project
    TimeGenerated,
    UserPrincipalName,
    ResourceGroup,
    SubscriptionId,
    KeyVaultName,
    KeyVaultTarget=id_s,
    OperationName

We can also do the same for applications instead of users.

//Searches for access by applications that have not previously accessed an Azure Key Vault in the last 30 days and returns all actions by those applications
let operationlist = dynamic(["SecretGet", "KeyGet", "VaultGet"]);
let starttime = 30d;
let endtime = 1d;
let detection=
    AzureDiagnostics
    | where TimeGenerated between (ago(starttime) .. ago(endtime))
    | where ResourceType == "VAULTS"
    | where ResultType == "Success"
    | where OperationName in (operationlist)
    | where isnotempty(identity_claim_appid_g)
    | project-rename KeyVaultName=Resource, AppId=identity_claim_appid_g
    | distinct KeyVaultName, AppId
    | join kind=rightanti  (
        AzureDiagnostics
        | where TimeGenerated > ago(endtime)
        | where ResourceType == "VAULTS"
        | where ResultType == "Success"
        | where OperationName in (operationlist)
        | where isnotempty(identity_claim_appid_g)
        | project-rename
            KeyVaultName=Resource,
            AppId=identity_claim_appid_g
        | distinct KeyVaultName, AppId)
        on KeyVaultName, AppId;
AzureDiagnostics
| where TimeGenerated > ago(endtime)
| where ResourceType == "VAULTS"
| where ResultType == "Success"
| project-rename
    KeyVaultName=Resource,
    AppId=identity_claim_appid_g
| join kind=inner detection on KeyVaultName, AppId
| project
    TimeGenerated,
    AppId,
    ResourceGroup,
    SubscriptionId,
    KeyVaultName,
    KeyVaultTarget=id_s,
    OperationName

Then finally we can also detect on operations that may be considered malicious or destructive, such as deletions, backups or purges. I have added some example operations, but there is a great list here that may have actions that are more specific to your Key Vaults.

// Detects Key Vault operations that could be malicious
let operationlist = dynamic(
    ["VaultDelete", "KeyDelete", "SecretDelete", "SecretPurge", "KeyPurge", "SecretBackup", "KeyBackup", "SecretListDeleted", "CertificateDelete", "CertificatePurge"]);
AzureDiagnostics
| where ResourceType == "VAULTS" and ResultType == "Success" 
| where OperationName in (operationlist)
| project TimeGenerated,
    ResourceGroup,
    SubscriptionId,
    KeyVaultName=Resource,
    KeyVaultTarget=id_s,
    Actor=identity_claim_upn_s,
    IPAddressofActor=CallerIPAddress,
    OperationName

There are some more queries located on the Sentinel GitHub page and the queries from this post can be found here.

Azure Sentinel and Azure AD Conditional Access = Cloud Fail2Ban — 2nd Sep 2021

Azure Sentinel and Azure AD Conditional Access = Cloud Fail2Ban

Fail2ban is a really simple but effective tool that has been around forever, it basically listens for incoming connections and then updates a firewall based on that, i.e. too many failed attempts then the IP is added to a ban list, rejecting new connections from it. If you are an Azure AD customer then Microsoft take care of some of this for you, they will ban the egregious attempts they are seeing globally. But we can use Azure Sentinel, Logic Apps and Azure AD Conditional Access to build our own cloud fail2ban which can achieve the same, but for threats unique to your tenant.

On the Azure Sentinel GitHub there is a really great query written for us here that we will leverage as the basis for our automation. The description says it all but essentially it will hunt the last 3 days of Azure AD sign in logs, look for more than 5 failures in a 20 minute period. It also excludes IP addresses in the same 20 minutes that have had more successful sign ins than failures just to account for your trusted locations – lots of users means lots of failed sign ins. You may want to adjust the timeframes to suit what works for you, but the premise remains the same.

There are a few moving parts to this automation but basically we want an Azure Sentinel Incident rule to run every so often, detect password sprays, any hit then invokes a Logic App that will update an Azure AD named location with the malicious IP addresses. That named location will be linked back to an Azure AD Conditional Access policy that denies logons.

Let’s build our Azure AD named location and CA policy first. In Azure AD Conditional Access > Named locations select ‘+ IP ranges location’, name it whatever you would like but something descriptive is best. You can’t have an empty named location so just put a placeholder IP address in there.

Next we create our Azure AD Conditional Access policy. Name is again up to you. Include all users and then it is always best practice to exclude some breakglass accounts, you don’t want to accidentally lock yourself out of your tenant or apps. We are going to also select All Cloud Apps because we want to block all access from these malicious IP addresses.

For conditions we want to configure Locations, including our named location we just created, and excluding our trusted locations (again, we don’t want to lock ourselves or our users out from known good locations). Finally our access control is ‘block access’. You can start the policy in report mode if you want to ensure your alerting and data is accurate.

Let’s grab the id of the named location we just created, since we will need it later on. Use the Graph Explorer to check for all named locations and grab the id of the one you just created.

Now we are ready to update the named location with our malicious IP. The guidance for the update action on the namedLocation endpoint is here. Which has an example of the payload we need to use and we will use Logic Apps to build it for us –

{
    "@odata.type": "#microsoft.graph.ipNamedLocation",
    "displayName": "Untrusted named location with only IPv4 address",
    "isTrusted": false,
    "ipRanges": [
        {
            "@odata.type": "#microsoft.graph.iPv4CidrRange",
            "cidrAddress": "6.5.4.3/18"
        }

    ]
}

Now we configure our Logic App, create a blank Logic App and for trigger choose either incident or alert creation, depending on whether you use the Azure Sentinel incident pane or not. After getting your IPs from the entities, create a couple of variables we will use later, and take the IP entity from the incident and append it to your NewMaliciousIP variable. We know that is the new bad IP we will want to block later.

There is no native Logic App connector for Azure AD Conditional Access, so we will just leverage Microsoft Graph to do what we need. This is a pattern that I have covered a few times, but it is one that I re-use often. We assign our Logic App a system assigned identity, use that identity to access an Azure Key Vault to retrieve a clientid, tenantid and secret for an Azure AD app registration. We then post to MS Graph and grab an access token and re-use that token as authorization to make the changes we want, in this case update a named location.

The URI value is your tenantid, then for body the client_id is your clientid and client_secret your secret. Make sure your app has enough privilege to update named locations, which is Policy.Read.All and Policy.ReadWrite.ConditionalAccess or an equivalent Azure AD role. Parse your token with the following schema and now you have a token ready to use.

{
    "properties": {
        "access_token": {
            "type": "string"
        },
        "expires_in": {
            "type": "string"
        },
        "expires_on": {
            "type": "string"
        },
        "ext_expires_in": {
            "type": "string"
        },
        "not_before": {
            "type": "string"
        },
        "resource": {
            "type": "string"
        },
        "token_type": {
            "type": "string"
        }
    },
    "type": "object"
}

To make this work, we need our Logic App to get the current list of bad IP addresses from our named location, add our new IP in and then patch it back to Microsoft Graph. If you just do a patch action with only the latest IP then all the existing ones will be removed. Over time this list could get quite large so we don’t want to lose our hard work.

We parse the JSON reponse using the following schema.

{
    "type": "object",
    "properties": {
        "@@odata.context": {
            "type": "string"
        },
        "@@odata.type": {
            "type": "string"
        },
        "id": {
            "type": "string"
        },
        "displayName": {
            "type": "string"
        },
        "modifiedDateTime": {
            "type": "string"
        },
        "createdDateTime": {
            "type": "string"
        },
        "isTrusted": {
            "type": "boolean"
        },
        "ipRanges": {
            "type": "array",
            "items": {
                "type": "object",
                "properties": {
                    "@@odata.type": {
                        "type": "string"
                    },
                    "cidrAddress": {
                        "type": "string"
                    }
                },
                "required": [
                    "@@odata.type",
                    "cidrAddress"
                ]
            }
        }
    }
}

Next we are going to grab each existing IP and append it to a string (we may have multiple IP addresses already in there so use a for-each loop to get them all), then build a final string adding our new malicious IP. You can see the format required in the Microsoft Graph documentation.

We parse string to JSON one last time because when we patch back to the Microsoft Graph it is expecting a JSON payload using the following schema.

{
    "items": {
        "properties": {
            "@@odata.type": {
                "type": "string"
            },
            "cidrAddress": {
                "type": "string"
            }
        },
        "required": [
            "@@odata.type",
            "cidrAddress"
        ],
        "type": "object"
    },
    "type": "array"
}

Then we are going to use a HTTP patch action to update our list, adding our access token to authorize ourselves and completing the format expected. In Logic Apps you need to escape @ symbols with another @. You will need to add in the id of your namedLocation which will be unique to you. The body is now in the exact format Graph expects.

The last part is to create our analytics rule and map our entities. For this example we will use the password spray query mentioned above, but really you could do any query that you generate a malicious IP from – Azure Security Centre alerts, IP addresses infected with malware etc. Just map your IP Address entity over so that our Logic App can collect it when it fires. Make sure you trigger an alert for each event as your analytics rule may return multiple hits and you want to block them all. Also be sure to run your analytics rule on a schedule that makes sense with the query you are running. If you are looking back on a days worth of data and generating alerts based off that, then you probably only want to run your analytics rule daily too. If you query 24 hours of data and run it every 20 minutes you will fire multiple alerts on the same bad IP addresses.

Then under your automated response options run the Logic App we just created. In your Logic App you could add another step at the end to let you know that Azure Sentinel has already banned the IP address for you. Now next time your Azure Sentinel analytics rule generates a hit on your query, the IP address will be blocked automatically.

Azure Sentinel and the story of a very persistent attacker — 30th Aug 2021

Azure Sentinel and the story of a very persistent attacker

Like many of you, over the last 18 months we have seen a huge shift in how our staff are working, people are at home, people working remotely permanently, or being unable to get into their regular office. That has meant a shift in your detections, previously you had people lighting up internal firewalls, or you saw events on your internal Active Directory, now you are also interested in cloud service access, suspicious MFA events or VPN activity.

With this change we unsurprisingly noticed a dramatic uptick in identity related alerts – users connecting from new counties, or via anonymous IP addresses, unfamiliar properties and impossible travel events. When we get these kind of events (even for failed attempts), we proactively log our users our of Azure AD to make them re-authenticate + MFA, it isn’t perfect but it’s an easy automation that doesn’t annoy anyone too much and buys some time for a cyber security team member to check out the detail. For each of these events we also populate the Azure Sentinel incident with the last 10 sign-ins for the user affected (excluding any from a trusted location) for someone to investigate.

SigninLogs
| where UserPrincipalName == "attackeduser@yourdomain.com"
| where IPAddress !startswith "10.10.10"
| project TimeGenerated, AppDisplayName, ResultType, ResultDescription, IPAddress, Location, UserAgent
| order by TimeGenerated desc 

Around January of this year we noticed a number of users showing really strange behaviour, they would have one or two wrong password attempts (ResultType 50126) flagged on their account from a location the user had never logged in from, and no other risk detections, just one or two attempts and that was it. After we noticed a half dozen the same, we decided to look a bit closer and noticed the same user agent being used for all the attempts, so we dug into the data. We looked for all sign in data from that agent, and bought back the user, the result, what application was being accessed, the IP and the location.

SigninLogs
| where UserAgent contains "Mozilla/5.0 (iPhone; CPU iPhone OS 12_2 like Mac OS X) AppleWebKit/605.1.15 (KHTML, like Gecko) Mobile/15E148"
| project UserPrincipalName, ResultType, AppDisplayName, IPAddress, Location

The data looked a bit like this – lots of attempts on different users, very rarely the same IP address or location twice in a row, locations not expected for our business, maybe two attempts at a user at most and then move on, and thankfully none successful, only wrong passwords (50126) and account locks (50053). We also noticed a second UserAgent with the same behaviour so we added that to the query and found more hits in much the same pattern.

SigninLogs
| where UserAgent contains "Mozilla/5.0 (iPhone; CPU iPhone OS 12_2 like Mac OS X) AppleWebKit/605.1.15 (KHTML, like Gecko) Mobile/15E148" or UserAgent contains "Outlook-iOS/723.4027091.prod.iphone (4.28.0)"
| project TimeGenerated, UserPrincipalName, ResultType, AppDisplayName, IPAddress, Location

Over a 6 month period, it was pretty low noise, peaking at 34 attempts in a single day, but usually less than 10.

We also double checked and there were no legitimate sign in activities from these UserAgents, only suspect ones. Some users were being targeted by one UserAgent, some the other and some by both, to detect those being targeted by both, you can use a simple join in KQL.

let agent1=
SigninLogs
| where UserAgent contains "Mozilla/5.0 (iPhone; CPU iPhone OS 12_2 like Mac OS X) AppleWebKit/605.1.15 (KHTML, like Gecko) Mobile/15E148"
| distinct UserPrincipalName;
let agent2=
SigninLogs
| where UserAgent contains "Outlook-iOS/723.4027091.prod.iphone (4.28.0)"
| distinct UserPrincipalName;
agent1
| join kind=inner agent2 on UserPrincipalName
| distinct UserPrincipalName

From January until now we have had around 1500 attempts from these UserAgents, targeting around 300 staff, with about 50 being targeted by both suspicious UserAgents.

Now that data is interesting for us cyber security people, but at the end of the day any Azure AD tenant is going to get some people knocking on the door and there isn’t much you can do about it, these IP addresses change so frequently that blocking them isn’t especially practical. Of the 1500 attempts we have seen about 660 different IP addresses. What we did do is configure an Azure Sentinel analytics rule to tell us if we got a successful sign in from one of these agents. The rule is straight forward, look for the UserAgent and any successful attempts.

let successCodes = dynamic([0, 50055, 50057, 50155, 50105, 50133, 50005, 50076, 50079, 50173, 50158, 50072, 50074, 53003, 53000, 53001, 50129]);
SigninLogs
| where UserAgent contains "Outlook-iOS/723.4027091.prod.iphone (4.28.0)" or UserAgent contains "Mozilla/5.0 (iPhone; CPU iPhone OS 12_2 like Mac OS X) AppleWebKit/605.1.15 (KHTML, like Gecko) Mobile/15E148"
| where ResultType in (successCodes)
| project UserPrincipalName

Importantly when we talk about success in Azure AD, we aren’t just interested in ResultType = 0. When we think about the flow of an Azure AD sign in, we can successfully sign in and then be blocked or stopped elsewhere. For instance 53003 means the sign on was stopped by conditional access. However, conditional access policies are applied after credentials have been validated, so in the case of an attacker, if they are blocked by conditional access it still means they have your users correct credentials. 50158 is another good example, which means an external security challenge failed (such as Ping Identity, Duo or Okta MFA), but the same logic applies – username and password are validated, then the user is directed to the third party security challenge. So for an attacker to get to that point, again they have the correct username and password. The KQL above has a list of everything that could be deemed a ‘success’.

We left this query running for around 8 months with no action, occasionally checking ourselves if the users were still be targeted, and they were. Finally last week we got a hit, a user had been phished (no one is perfect!) and the attackers signed into the account, thankfully they were stopped by a conditional access policy blocking sign ins from the particular country they tried on that attempt. We contacted the user, reset their credentials, sent them some phishing training and away they went.

In the scheme of Azure AD globally, 1500 attempts to a single tenant over the course of 8 months is not even a rounding error, Microsoft is evaluating millions of sign ins an hour and this traffic isn’t likely to flag anything special at their end. It was suspicious to our business though, and that is where your knowledge of your environment combined with the tools on offer is where you add real value.

If you are interested more generally in how often you are seeing new UserAgents for your users you can use the below query, we create a set of known UserAgent for each user over a learning period (14 days), then join against the last day (and exclude known corporate IP’s)

let successCodes = dynamic([0, 50055, 50057, 50155, 50105, 50133, 50005, 50076, 50079, 50173, 50158, 50072, 50074, 53003, 53000, 53001, 50129]);
let isGUID = "[0-9a-z]{8}-[0-9a-z]{4}-[0-9a-z]{4}-[0-9a-z]{4}-[0-9a-z]{12}";
let lookbacktime = 14d;
let detectiontime = 1d;
let UserAgentHistory =
SigninLogs
    | project TimeGenerated, UserPrincipalName, UserAgent, ResultType, IPAddress
    | where TimeGenerated between(ago(lookbacktime)..ago(detectiontime))
    | where ResultType in (successCodes)
    | where not (UserPrincipalName matches regex isGUID)
    | where isnotempty(UserAgent)
    | summarize UserAgentHistory = count() by UserAgent, UserPrincipalName;
SigninLogs
    | where TimeGenerated > ago(detectiontime)
    | where ResultType in (successCodes)
    | where IPAddress !startswith "10.10.10"
    | where not (UserPrincipalName matches regex isGUID)
    | where isnotempty(UserAgent)
    | join kind=leftanti UserAgentHistory on UserAgent, UserPrincipalName
    | distinct UserPrincipalName, AppDisplayName, ResultType, UserAgent

UserAgents can update quite often, mobile devices getting small updates, browsers being patched, but like everything, getting to know what is normal in your environment and detecting outside of that is half the battle won.

CrowdStrike Falcon, Defender for Endpoint and Azure Sentinel. — 19th Aug 2021

CrowdStrike Falcon, Defender for Endpoint and Azure Sentinel.

Remember when antivirus software was the cause of every problem on devices? Workstation running slow? Disable AV. Server running slow, put in a heap of exclusions. Third party app not working, more exclusions. The thought of running multiple antivirus products on an endpoint was outrageous, and basically every vendor told you explicitly not to do it. Thankfully times change, due to a combination of smarter endpoint security products, more powerful computers and a willingness of Microsoft to work along side other vendors, that is no longer the case. Defender for Endpoint now happily sits behind other products in ‘passive mode’, like CrowdStrike Falcon, while still sending great data and integrating into apps like Cloud App Security, you can connect M365 to Sentinel with a native connector.

So if you are paying for a non Microsoft product like CrowdStrike or Carbon Black, you probably don’t want to send all the data from those products to Azure Sentinel as well, because a) you are paying for that privilege with your endpoint security vendor already, b) that product may either be managed by the vendor themselves, a partner and/or c) even if you manage it yourself, the quality of the native tooling in those products is part of the reason you pay the money for it and it doesn’t make a lot of sense to lift every event out of there, into Sentinel and try and recreate the wheel.

What we can do though is send some low volume, but high quality data into Sentinel to jump start further investigations or automations based on other data we have in there – the logs from Defender for Endpoint in passive mode, the SecurityAlert table from things like Azure Security Center or Defender for ID, Azure AD sign in logs etc. So for CrowdStrike, in this example, we are just going to send a webhook to Sentinel each time a detection is found, then ingest that into a custom table using a simple Logic App so we can expand our hunting. Hopefully you don’t get too many detections, so this data will basically cost nothing.

On the Azure Sentinel side we first create a new Logic App with the ‘When a HTTP request is received’ trigger, once you save it you will be given your webhook URL. Grab that address then head over to CrowdStrike and create your notification workflow, which is a simple process outlined here.

For the actions, we are just going to call our webhook and send the following data on each new detection.

Now each time a detection is created in CrowdStrike Falcon it will send the data to our Logic App. The last part is to configure the Logic App to then push that data to Azure Sentinel which we do with three quick actions. First, we parse the JSON that is inbound from CrowdStrike, if you are using the same data as myself then the schema for this is –

{
    "properties": {
        "data": {
            "properties": {
                "detections.severity": {
                    "type": "string"
                },
                "detections.tactic": {
                    "type": "string"
                },
                "detections.technique": {
                    "type": "string"
                },
                "detections.url": {
                    "type": "string"
                },
                "detections.user_name": {
                    "type": "string"
                },
                "devices.domain": {
                    "type": [
                        "string",
                        "null"
                    ]
                },
                "devices.hostname": {
                    "type": "string"
                }
            },
            "type": "object"
        },
        "meta": {
            "properties": {
                "event_reference_url": {
                    "type": "string"
                },
                "timestamp": {
                    "type": "integer"
                },
                "trigger_name": {
                    "type": "string"
                },
                "workflow_id": {
                    "type": "string"
                }
            },
            "type": "object"
        }
    },
    "type": "object"
}

Then we are going to compose a new JSON payload where we change the column headers to something a little easier to read, then send that data to Sentinel using the ‘Send data’ action. So our entire ingestion playbook is just four steps.

You can create test detections by following the CrowdStrike support article. You should see alerts start to flow in to your CrowdStrikeAlerts_CL.

Once you have some data in there you can start visualizing trends in your data, what types of techniques are being seen –

CrowdStrikeAlerts_CL
| summarize count()by Technique_s
| render piechart 

Where the real value is with getting these detections into Sentinel is leveraging all the other data already in there and then automating response. One of the most simple things is to take the username from your alert and join it to your IdentifyInfo table (powered by UEBA) and find out some more information about the user. Your Azure AD identity information is highly likely to be of greater quality than almost anywhere else. So grab your alert, join it to your identity table grabbing the most recent record for the user –

CrowdStrikeAlerts_CL
| project Hostname_s, AlertSeverity_s, Technique_s, Username_s, AlertLink_s
| join kind=inner
(
IdentityInfo
| where TimeGenerated > ago(21d)
| summarize arg_max(TimeGenerated, *) by AccountName
)
on $left.Username_s == $right.AccountName
| project Hostname_s, AlertSeverity_s, Technique_s, Username_s, AccountUPN, Country, EmployeeId, Manager, AlertLink_s

Now on our alerts we get not only the info from CrowdStrike but the information from our IdentityInfo table, so where the user is located, their UPN, manager and whatever else we want.

We can use the DeviceLogonEvents from Defender to find out if the user is a local admin on that device. You may want to prioritize those detections because there is greater chance of damage being done and lateral movement when the user is an admin –

let csalert=
CrowdStrikeAlerts_CL
| where TimeGenerated > ago (1d)
| project HostName=Hostname_s, AccountName=Username_s, Technique_s, AlertSeverity_s;
DeviceLogonEvents
| where TimeGenerated > ago (1d)
| join kind=inner csalert on HostName, AccountName
| where LogonType == "Interactive"
| where InitiatingProcessFileName == "lsass.exe"
| summarize arg_max(TimeGenerated, *) by DeviceName
| project TimeGenerated, DeviceName, IsLocalAdmin

If a user is flagged using suspicious PowerShell, we can grab the alert, then find any PowerShell events in a 30 minute window (15 mins either side of your alert). When you are joining different tables you just need to check how each table references your device names. You may need to trim or adjust the naming so they match up. You can use the tolower function to drop everything to lower case and trim(@”.yourdomain.com”,DeviceName) if you need to remove your domain name in order to match.

let csalert=
CrowdStrikeAlerts_CL
| where TimeGenerated > ago(1d)
| extend AlertTime = TimeGenerated
| where Technique_s == "PowerShell"
| project AlertTime, Hostname_s, AlertSeverity_s, Technique_s, Username_s;
DeviceProcessEvents
| where TimeGenerated > ago(1d)
| join kind=inner csalert on $left.DeviceName == $right.Hostname_s
| where InitiatingProcessFileName contains "powershell"
| where TimeGenerated between ((AlertTime-timespan(15min)).. (AlertTime+timespan(15min)))

We can look up the device which flagged a CrowdStrike detection and see if it has been flagged elsewhere in SecurityAlert table, maybe by Defender for ID or another product you have. Again, just check out the structure of your various tables as your naming may not be exactly the same but use your trim and other functions to line them up.

let csalert=
CrowdStrikeAlerts_CL
| where TimeGenerated > ago(4d)
| project Hostname_s, AlertSeverity_s, Username_s
| join kind=inner (
IdentityInfo
| where TimeGenerated > ago(21d)
| summarize arg_max(TimeGenerated, *) by AccountName)
on $left.Username_s == $right.AccountName
| project Hostname_s, AlertSeverity_s, Username_s, AccountUPN;
SecurityAlert
| where TimeGenerated > ago (7d)
| join kind=inner csalert on $left.CompromisedEntity == $right.Hostname_s

And the same for user alerts, possibly from your identity products like Azure AD Identity Protection or Cloud App Security. We can use our identity table to make sense of different types of usernames these products may use. CrowdStrike or your AV may use samaccountname, where Cloud App uses userprincipalname for instance.

let csalert=
CrowdStrikeAlerts_CL
| where TimeGenerated > ago(4d)
| project Hostname_s, AlertSeverity_s, Username_s
| join kind=inner (
IdentityInfo
| where TimeGenerated > ago(21d)
| summarize arg_max(TimeGenerated, *) by AccountName)
on $left.Username_s == $right.AccountName
| project Hostname_s, AlertSeverity_s, Username_s, AccountUPN;
SecurityAlert
| where TimeGenerated > ago (7d)
| join kind=inner csalert on $left.CompromisedEntity == $right.AccountUPN

It’s great being alerted to things and having information available to investigate, but sometimes an alert is of a high enough priority that you want to respond to it automatically. With CrowdStrike, the team have built a few playbooks we can leverage, which are located here. The three we are interested in are CrowdStrike_base which handles authentication to their API, CrowdStrike_Enrichment_GetDeviceInformation which retrieves host information about a device and finally CrowdStrike_ContainHost which will network contain a device for us. This playbook works by retrieving the hostname from the Sentinel entity mapping, searching CrowdStrike for a matching asset and containing it. Deploy the base playbook first, because the other two depend on it to access the API. You will also need an API key from your CrowdStrike tenant with enough privilege.

Once deployed you can either require someone to run the playbook manually or you can automate it entirely. For alerts that come in from CrowdStrike, or other AV products there is a good chance you already have the rules set up to determine response to detections. However we can use the same playbook to contain devices that we find when hunting through log data that CrowdStrike don’t see. For instance Defender for ID is going to be hunting for different threats than an endpoint security product. CrowdStrike may not generally care about domain recon or it may not detect pass the hash type activity, but Defender for ID definitely will. If we want to network contain based on domain recon flagged by Defender for ID we parse out the entities from the alert, then we can trigger our playbook based on that. We want to exclude our domain controllers from the entities, because they are the target of the attack and we don’t want to contain those, but we do the endpoint initiating the behaviour.

SecurityAlert
| where ProviderName contains "Azure Advanced Threat Protection"
| where AlertName contains "reconnaissance"
| extend EntitiesDynamicArray = parse_json(Entities) | mv-expand EntitiesDynamicArray
| extend EntityType = tostring(parse_json(EntitiesDynamicArray).Type), EntityAddress = tostring(EntitiesDynamicArray.Address), EntityHostName = tostring(EntitiesDynamicArray.HostName)
| extend HostName = iif(EntityType == 'host', EntityHostName, '')
| where HostName !contains "ADDC" and isnotempty(HostName)
| distinct HostName, AlertName, VendorOriginalId, ProviderName

You can also grab identity alerts, such as ‘Mass Download’, lookup your DeviceLogonEvents table to find the machine most recently used by the person who triggered it, then isolate the host based off that. Our SecurityAlert table uses userprincipalname and our DeviceLogonEvents uses the old style username, so we again use our IdentityInfo table to piece them together.

let alert=
SecurityAlert
| where AlertName has "Mass Download"
| project CompromisedEntity
| join kind=inner 
(
IdentityInfo
| where TimeGenerated > ago (21d)
| summarize arg_max (TimeGenerated, *) by AccountUPN
)
on $left.CompromisedEntity == $right.AccountUPN
| project CompromisedEntity, AccountUPN, AccountName;
DeviceLogonEvents
| where TimeGenerated > ago (1d)
| join kind=inner alert on AccountName
| where LogonType == "Interactive"
| where InitiatingProcessFileName == "lsass.exe"
| summarize arg_max(TimeGenerated, *) by DeviceName
| project DeviceName, CompromisedEntity, AccountName

Most identity driven alerts from Cloud App Security or Azure AD Identity Protection won’t actually have the device name listed, we leverage our other data to go find it. Now we have the device name which our user last logged onto for our ‘Mass Download’ events, we can isolate the machine, or at the very least investigate further. Of course the device we found may not necessarily be the one that has flagged the alert – but you may want to play it safe and contain it anyway while also responding to the identity side of the alert.

Detecting anomalies unique to your environment with Azure Sentinel — 13th Aug 2021

Detecting anomalies unique to your environment with Azure Sentinel

One of the lesser known and more interesting operators that you can use with KQL is series_decompose_anomalies. When you first read the Microsoft article it is a little intimidating to be honest but thankfully there is a community post here that explains it quite well. Essentially, we can use the series_decompose_anomalies operator to look for anomalies in time series data. We can use the various aggregation functions in KQL to turn our log data into time series data. The structure of these queries are all similar, we want to create some parameters to use in our query, build our time series data, then look for anomalies within it. Then finally we want to make some sense of those anomalies by applying them to our raw log data and optionally visualize the anomalies. Easy!

Let’s use Azure AD sign in logs as a first example, there is a good chance you have plenty of data in your tenant and the logs come with plenty of information. We will try and find some anomalies in the amount of a few error codes. Start by creating some parameters to use throughout the query.

let starttime = 7d;
let timeframe = 1h;
let resultcodes = dynamic(["50126","53003","50105"]);

So we are going to look at the last 7 days of data, break it down into one hour blocks and look for 3 particular error codes which are 50126 (wrong username and password), 53003 (access blocked by conditional access) and 50105 (user signed in correctly but doesn’t have access to the resource). So let’s run the query to look for those, and then make a time series dataset from the results using the make-series operator.

let starttime = 7d;
let timeframe = 1h;
let resultcodes = dynamic(["50126","53003","50105"]);
SigninLogs
| where TimeGenerated > ago(starttime)
| where ResultType in (resultcodes)
| project TimeGenerated, UserPrincipalName, ResultType, AppDisplayName, Location
| order by TimeGenerated
| summarize Events=count()by UserPrincipalName, bin(TimeGenerated, timeframe)
| summarize EventCount=make_list(Events),TimeGenerated=make_list(TimeGenerated) by UserPrincipalName

You should be left with three columns, all the one hour time blocks, how many events in each block and the userprincipalname.

Now we are going to use our series_decompose_anomalies operator to find anomalies in the data set.

let starttime = 7d;
let timeframe = 1h;
let resultcodes = dynamic(["50126","53003","50105"]);
SigninLogs
| where TimeGenerated > ago(starttime)
| where ResultType in (resultcodes)
| project TimeGenerated, UserPrincipalName, ResultType, AppDisplayName, Location
| order by TimeGenerated
| summarize Events=count()by UserPrincipalName, bin(TimeGenerated, timeframe)
| summarize EventCount=make_list(Events),TimeGenerated=make_list(TimeGenerated) by UserPrincipalName
| extend outliers=series_decompose_anomalies(EventCount)

We can see that we get some hits on 1 (more events than expected), -1 (less than expected) and lots of 0 (as expected).

It retains all the outliers in a single series, but we want to use the mv-expand operator to get our outliers as a single row, and for this case we are only interested where outliers = 1 (more events than expected)

let starttime = 30d;
let timeframe = 1h;
let resultcodes = dynamic(["50126","53003","50105"]);
SigninLogs
| where TimeGenerated > ago(starttime)
| where ResultType in (resultcodes)
| project TimeGenerated, UserPrincipalName, ResultType, AppDisplayName, Location
| make-series totalevents = count()on TimeGenerated from ago(starttime) step timeframe by ResultType
| extend outliers=series_decompose_anomalies(totalevents)
| mv-expand TimeGenerated, totalevents, outliers
| where outliers == 1

Which will give us an output showing which hour had the increase, how many events in that hour and the userprincipalname.

Now the key is making some sense of this data; to do that we are actually going to take the results of our query and cast it as a variable, then run it back through our sign in data to pull out information that is useful. So we can call our first query ‘outlierusers’ and we are only interested in grabbing each username once. We know this account has been flagged with our query, so we use the distinct operator to only retrieve it a single time.

let starttime = 7d;
let timeframe = 1h;
let resultcodes = dynamic(["50126","53003","50105"]);
let outlierusers=
SigninLogs
| where TimeGenerated > ago(starttime)
| where ResultType in (resultcodes)
| project TimeGenerated, UserPrincipalName, ResultType, AppDisplayName, Location
| order by TimeGenerated
| summarize Events=count()by UserPrincipalName, bin(TimeGenerated, timeframe)
| summarize EventCount=make_list(Events),TimeGenerated=make_list(TimeGenerated) by UserPrincipalName
| extend outliers=series_decompose_anomalies(EventCount)
| mv-expand TimeGenerated, EventCount, outliers
| where outliers == 1
| distinct UserPrincipalName;

Then we use our first query as a variable to our second and get a visualization of our outlier users – | where UserPrincipalName in (outlierusers). You can keep either the same time frame for the second part of your query, or make it different. You could look for 7 days of data to detect your anomalies and then hunt just the last day for your more detailed information. In this example we will keep the same, 7 days in 1 hour blocks.

let starttime = 7d;
let timeframe = 1h;
let resultcodes = dynamic(["50126","53003","50105"]);
let outlierusers=
SigninLogs
| where TimeGenerated > ago(starttime)
| where ResultType in (resultcodes)
| project TimeGenerated, UserPrincipalName, ResultType, AppDisplayName, Location
| order by TimeGenerated
| summarize Events=count()by UserPrincipalName, bin(TimeGenerated, timeframe)
| summarize EventCount=make_list(Events),TimeGenerated=make_list(TimeGenerated) by UserPrincipalName
| extend outliers=series_decompose_anomalies(EventCount)
| mv-expand TimeGenerated, EventCount, outliers
| where outliers == 1
| distinct UserPrincipalName;
SigninLogs
| where TimeGenerated > ago(starttime)
| where UserPrincipalName in (outlierusers)
| where ResultType != 0
| summarize LogonCount=count() by UserPrincipalName, bin(TimeGenerated, timeframe)
| render timechart 

So we end up with a time chart showing the users, and the hour blocks where the anomaly detection occurred.

So to recap for each query we want to

  • Set parameters
  • Build a time series
  • Detect anomalies
  • Apply that to a broader data set to enrich your alerting

Another example, let’s search the OfficeActivity table for download events, hunt for the anomalies, then use that data to track down the users last logged on machine and retrieve all USB file copy events.


let starttime = 7d;
let timeframe = 30m;
let operations = dynamic(["FileSyncDownloadedFull","FileDownloaded"]);
let outlierusers=
OfficeActivity
| where TimeGenerated > ago(starttime)
| where Operation in (['operations'])
| extend UserPrincipalName = UserId
| project TimeGenerated, UserPrincipalName
| order by TimeGenerated
| summarize Events=count()by UserPrincipalName, bin(TimeGenerated, timeframe)
| summarize EventCount=make_list(Events),TimeGenerated=make_list(TimeGenerated) by UserPrincipalName
| extend outliers=series_decompose_anomalies(EventCount)
| mv-expand TimeGenerated, EventCount, outliers
| where outliers == 1
| distinct UserPrincipalName;
let id=
IdentityInfo
| where AccountUPN in (outlierusers)
| where TimeGenerated > ago (21d)
| summarize arg_max(TimeGenerated, *) by AccountName
| extend LoggedOnUser = AccountName
| project LoggedOnUser, AccountUPN, JobTitle, EmployeeId, Country, City
| join kind=inner (
DeviceInfo
| where TimeGenerated > ago (21d)
| summarize arg_max(TimeGenerated, *) by DeviceName
| extend LoggedOnUser = tostring(LoggedOnUsers[0].UserName)
) on LoggedOnUser
| project LoggedOnUser, AccountUPN, JobTitle, Country, DeviceName, EmployeeId;
DeviceEvents
| where TimeGenerated > ago(7d)
| join kind=inner id on DeviceName
| where ActionType == "UsbDriveMounted"
| extend DriveLetter = tostring(todynamic(AdditionalFields).DriveLetter)
| join kind=inner (DeviceFileEvents
| where TimeGenerated > ago(7d)
| extend FileCopyTime = TimeGenerated
| where ActionType == "FileCreated"
| parse FolderPath with DriveLetter '\\' *
| extend DriveLetter = tostring(DriveLetter)
) on DeviceId, DriveLetter
| extend FileCopied = FileName1
| distinct DeviceName, DriveLetter, FileCopied, LoggedOnUser, AccountUPN, JobTitle, EmployeeId, Country

You will be returned a list of file USB file creation activities for each user who had higher than expected Office download actions.

Want to check whether you have had a sharp increase in syslog activity from certain machines?

let starttime = 5d;
let timeframe = 30m;
let Computers=Syslog
| where TimeGenerated >= ago(starttime)
| summarize EventCount=count() by Computer, bin(TimeGenerated,timeframe)
| where EventCount > 1500
| order by TimeGenerated
| summarize EventCount=make_list(EventCount),TimeGenerated=make_list(TimeGenerated) by Computer
| extend outliers=series_decompose_anomalies(EventCount,2)
| mv-expand TimeGenerated, EventCount, outliers
| where outliers == 1
| distinct Computer
;
Syslog
| where TimeGenerated >= ago(starttime)
| where Computer in (Computers)
| summarize EventCount=count() by Computer, bin(TimeGenerated, timeframe)
| render timechart 

In this query we have also increased the detection threshold from the default 1.5 to 2 with | extend outliers=series_decompose_anomalies(EventCount,2). We have also excluded machines with less than 1500 events per 30 minutes with | where EventCount > 1500. Maybe we don’t care if an anomaly is detected until it goes over that threshold. That is where you will need to combine the smarts of Azure Sentinel and KQL with your knowledge of your environment; what Sentinel things is strange may be normal to you. So spend some time making sure the first three steps are sound – your parameters, your time series and what you consider anomalous to your specific environment.

There are a heap of great queries on the official GitHub here and I have started to upload any useful queries to my own.

Streaming Azure AD risk events to Azure Sentinel — 5th Aug 2021

Streaming Azure AD risk events to Azure Sentinel

Microsoft recently added the ability to stream risk events from Azure AD Identity Protection into Azure Sentinel, check out the guidance here. You can add the data in the Azure AD -> Diagnostic Settings page, and once enabled you will see data stream into two new tables

  • AADUserRiskEvents – this is the data that you would see in Azure AD Identity Protection if you went and viewed the risk detections, or risky sign-in reports
  • AADRiskyUsers – this is the data from the Risky Users blade in Azure AD Identity Protection but streamed as log data, so will include when users are remediated.

This is a really welcome addition because there has always been an overlap with where detections are found, Azure AD Identity Protection will find some stuff, Microsoft Cloud App Security will find its own things, there is some crossover, and you may not be licensed for everything. Also having the data in Sentinel means you can query it against other log sources more unique to your environment. If you want to visualize the type of risk events in your environment you can do so. Keep in mind this data will only start populating once you enable it, any risk events prior to that won’t be resent to Azure Sentinel.

AADUserRiskEvents
| where isnotempty( RiskEventType)
| summarize count()by RiskEventType
| render piechart 

You can see here some of the overlap, you get unlikelyTravel and mcasImpossibleTravel, you can also have a look at where the data is coming from.

AADUserRiskEvents
| where isnotempty( RiskEventType)
| summarize count()by RiskEventType, Source

If you look at an AADUserRiskEvents event in detail, you see a column for DetectionTimingType – which tells us whether the detection is realtime (on sign in) or offline.

AADUserRiskEvents
| where isnotempty( DetectionTimingType) 
| summarize count()by DetectionTimingType, RiskEventType, Source

So we get some realtime alerts and some offline alerts from a number of sources. At the end of the day, more data is always useful, even if users will trigger multiple alerts if you are licensed for both systems. For anyone that has spent time looking at Azure AD sign in data, you would also know that there are risk items in those logs too, so how to we match up the data from a sign in to the data in our new AADUserRiskEvents? Thankfully when a sign in occurs that flags a risk event, it registers the same correlation id on both tables. So we can join between them and extract some really great data from both tables. Sign in data has all the information about what the user was accessing, conditional access rules, what client etc and then we can also get the data from our risk events.

let signin=
SigninLogs
| where TimeGenerated > ago(24h)
| where RiskEventTypes_V2 != "[]";
AADUserRiskEvents
| where TimeGenerated > ago(24h)
| join kind=inner signin on CorrelationId

When a user sign-ins with no risk unfortunately the RiskEventTypes_V2 table is actually not actually empty, it is just [], so we exclude those, then join on the correlation id to our risk events and you will get the data from both. We can even extend the columns and calculate the time delta between the sign in event and the risk event, for real time that is obviously going to be quick, but for offline you can find out how long it took for the risk to be flagged.

let signin=
SigninLogs
| where TimeGenerated > ago(24h)
| extend SigninTime = TimeGenerated
| where RiskEventTypes_V2 != "[]";
AADUserRiskEvents
| where TimeGenerated > ago(24h)
| extend RiskTime = TimeGenerated
| join kind=inner signin on CorrelationId
| extend TimeDelta = abs(SigninTime - RiskTime)
| project UserPrincipalName, AppDisplayName, DetectionTimingType, SigninTime, RiskTime, TimeDelta, RiskLevelDuringSignIn, Source, RiskEventType

When looking at these risk events, you may notice a column called RiskDetail, and occasionally you will see aiConfirmedSigninSafe. This is basically Microsoft flagging the risk event as safe based on some kind of signals they are seeing. They won’t tell you what is in the secret sauce to confirm it is safe but we can guess it is a combination of properties they have seen before for that user – maybe an IP address, location or user agent known seen previously. So we can probably exclude those from things we are worried about. Maybe you also only care about realtime detections considered medium or high, so we filter out offline detections and low risk events.

let signin=
SigninLogs
| where TimeGenerated > ago(24h)
| where RiskLevelDuringSignIn in ('high','medium')
| extend SigninTime = TimeGenerated
| where RiskEventTypes_V2 != "[]";
AADUserRiskEvents
| where TimeGenerated > ago(24h)
| extend RiskTime = TimeGenerated
| where DetectionTimingType == "realtime"
| where RiskDetail !has "aiConfirmedSigninSafe"
| join kind=inner signin on CorrelationId
| extend TimeDelta = abs(SigninTime - RiskTime)
| project UserPrincipalName, AppDisplayName, DetectionTimingType, SigninTime, RiskTime, TimeDelta, RiskLevelDuringSignIn, Source, RiskEventType, RiskDetail

You can visualize these events per day if you wanted to have an idea if you are seeing increases at all. Keep in mind this table is relatively new so you won’t have a lot of historical data to work with, and again the data won’t appear at all until you enable the diagnostic setting. But over time it will help you create a baseline of what is normal in your environment.

let signin=
SigninLogs
| where RiskLevelDuringSignIn in ('high','medium')
| extend SigninTime = TimeGenerated
| where RiskEventTypes_V2 != "[]";
AADUserRiskEvents
| extend RiskTime = TimeGenerated
| where DetectionTimingType == "realtime"
| where RiskDetail !has "aiConfirmedSigninSafe"
| join kind=inner signin on CorrelationId
| extend TimeDelta = abs(SigninTime - RiskTime)
| summarize count(RiskEventType) by bin(TimeGenerated, 1d), RiskEventType
| render columnchart  

If you have Azure Sentinel UEBA enabled, you can even enrich your queries with that data, which includes things like City, Country, Assigned Azure AD roles, group membership etc.

let id=
IdentityInfo
| summarize arg_max(TimeGenerated, *) by AccountUPN;
let signin=
SigninLogs
| where TimeGenerated > ago (14d)
| where RiskLevelDuringSignIn in ('high','medium')
| join kind=inner id on $left.UserPrincipalName == $right.AccountUPN
| extend SigninTime = TimeGenerated
| where RiskEventTypes_V2 != "[]";
AADUserRiskEvents
| where TimeGenerated > ago (14d)
| extend RiskTime = TimeGenerated
| where DetectionTimingType == "realtime"
| where RiskDetail !has "aiConfirmedSigninSafe"
| join kind=inner signin on CorrelationId
| extend TimeDelta = abs(SigninTime - RiskTime)
| project SigninTime, UserPrincipalName, RiskTime, TimeDelta, RiskEventTypes, RiskLevelDuringSignIn, City, Country, EmployeeId, AssignedRoles

If you were then to filter on only alerts where the users have an assigned Azure AD role.

let id=
IdentityInfo
| summarize arg_max(TimeGenerated, *) by AccountUPN;
let signin=
SigninLogs
| where TimeGenerated > ago (14d)
| where RiskLevelDuringSignIn in ('high','medium')
| join kind=inner id on $left.UserPrincipalName == $right.AccountUPN
| extend SigninTime = TimeGenerated
| where RiskEventTypes_V2 != "[]";
AADUserRiskEvents
| where TimeGenerated > ago (14d)
| extend RiskTime = TimeGenerated
| where DetectionTimingType == "realtime"
| where RiskDetail !has "aiConfirmedSigninSafe"
| join kind=inner signin on CorrelationId
| where AssignedRoles != "[]"
| extend TimeDelta = abs(SigninTime - RiskTime)
| project SigninTime, UserPrincipalName, RiskTime, TimeDelta, RiskEventTypes, RiskLevelDuringSignIn, City, Country, EmployeeId, AssignedRoles

This kind of combination of attributes – realtime risk which is either medium or high, which Microsoft has not confirmed as safe and the user has an Azure AD role assigned may warrant a faster response from you or your team.

Supercharge your queries with Azure Sentinel UEBA’s IdentityInfo table — 29th Jul 2021

Supercharge your queries with Azure Sentinel UEBA’s IdentityInfo table

For those that use Sentinel, hopefully you have turned on the User and Entity Behaviour Analytics, the cost is fairly negligible and it’s what drives the entity and investigation experiences in Sentinel. There are plenty of articles and blogs around to cover how to use those. I wanted to give you some really great examples of leveraging the same information to make your investigation and rules even better.

When you turn on UEBA you end up with four new tables

  • BehaviorAnalytics – this tracks things like logons or group changes, but goes beyond that and measures if the event is uncommon
  • UserAccessAnalytics – tracks users access, such as group membership but also maintains information such as when the access was first granted
  • PeerAccessAnalytics – maintains a list of a users closest peers which helps to evaluate potential blast radius
  • IdentityUserInfo – maintains a table of identity info from both on premise and cloud for users

We have access those like any other tables even when not using the entity or investigation pages. So let’s have a look at a few examples of using that data to make meaningful queries. The IdentityInfo table is a combination of Azure AD and on-premise AD data and it is a godsend – especially for those of us who still have a large on premise footprint. Previously you had to ingest a lot of this data yourself. Have a read of the Tech Community post here which has the details of this table. We essentially turn our identity data into log data, which is great for threat hunting. You just need to make sure you write your queries to account for multiple entries for users, such as using the take operator, or the arg_max operator.

Have a system that likes to respond using SIDs for users alerts instead of usernames? Here we look for lockout events, grab the SID of the account and then join to the IdentityInfo table where we get information that is actually useful to us. Remember that the IdentityInfo is a table and will have multiple entries for users, so just retrieve the latest record

let alert=
SecurityEvent
| where EventID == "4740"
| extend AccountSID = TargetSid
| project AccountSID, Activity;
IdentityInfo
| join kind=inner alert on AccountSID
| sort by TimeGenerated desc
| take 1
| project AccountName, Activity, AccountSID, AccountDisplayName, JobTitle, Phone, IsAccountEnabled, AccountUPN

Do you grant access to an admin server for your IT staff and want to audit to make sure its being used? This query will find the enabled members of the group “ADMINSERVER01 – RDP Access” then query for successful RDP logons to it. We use the rightanti join in Kusto, and the output will be users who have access, but haven’t connected in 30 days.

let users=
IdentityInfo
| where TimeGenerated > ago (7d)
| where GroupMembership has "ADMINSERVER01 - RDP Access"
| extend OnPremAccount = AccountName
| where IsAccountEnabled == true
| distinct OnPremAccount, AccountUPN, EmployeeId, IsAccountEnabled;
SecurityEvent
| where TimeGenerated > ago (30d)
| where EventID == 4624
| where LogonType == 10
| where Computer has "ADMINSERVER01"
| sort by TimeGenerated desc 
| extend OnPremAccount = trim_start(@"DOMAIN\\", Account)
| summarize arg_max (TimeGenerated, *) by OnPremAccount
| join kind=rightanti users on OnPremAccount
| project OnPremAccount, AccountUPN, IsAccountEnabled

Have an application that you use Azure AD for SSO, but access control is granted from on premise AD groups? You can do a similar join to SigninLogs data.

let users=
IdentityInfo
| where TimeGenerated > ago (7d)
| where GroupMembership has "Business App Access"
| extend UserPrincipalName = AccountUPN
| distinct UserPrincipalName, EmployeeId, IsAccountEnabled;
SigninLogs
| where TimeGenerated > ago (30d)
| where AppDisplayName contains "Business App"
| where ResultType == 0
| sort by TimeGenerated desc
| summarize arg_max(TimeGenerated, AppDisplayName) by UserPrincipalName
| join kind=rightanti users on UserPrincipalName
| project UserPrincipalName, EmployeeId, IsAccountEnabled

Again this will show you who has access but hasn’t authenticated via Azure AD in 30 days. Access reviews in Azure AD can help you with this too, but it’s a P2 feature you may not have, and it won’t be able to change on premise AD group membership.

You could query the IdentityInfo table for users with certain privileged Azure AD roles and correlate with Cloud App Security alerts to prioritize them higher.

let PrivilgedRoles = dynamic(["Global Administrator","Security Administrator","Teams Administrator", "Security Administrator"]);
let PrivilegedIdentities = 
IdentityInfo
| summarize arg_max(TimeGenerated, *) by AccountObjectId
| mv-expand AssignedRoles
| where AssignedRoles in~ (PrivilgedRoles)
| summarize AssignedRoles=make_set(AssignedRoles) by AccountObjectId, AccountSID, AccountUPN, AccountDisplayName, JobTitle, Department;
SecurityAlert
| where TimeGenerated > ago (7d)
| where ProviderName has "MCAS"
| project CompromisedEntity, AlertName, AlertSeverity
| join kind=inner PrivilegedIdentities on $left.CompromisedEntity == $right.AccountUPN
| project TimeGenerated, AccountDisplayName, AccountObjectId, AccountSID, AccountUPN, AlertSeverity, AlertName, AssignedRoles

And finally using the same logic to find users with privileged roles and detecting any Azure AD Conditional Access failures for them

let PrivilgedRoles = dynamic(["Global Administrator","Security Administrator","Teams Administrator", "Exchange Administrator"]);
let PrivilegedIdentities = 
IdentityInfo
| summarize arg_max(TimeGenerated, *) by AccountObjectId
| mv-expand AssignedRoles
| where AssignedRoles in~ (PrivilgedRoles)
| summarize AssignedRoles=make_set(AssignedRoles) by AccountObjectId, AccountSID, AccountUPN, AccountDisplayName, JobTitle, Department;
SigninLogs
| where TimeGenerated > ago (30d)
| where ResultType == 53003
| join kind=inner PrivilegedIdentities on $left.UserPrincipalName == $right.AccountUPN
| project TimeGenerated, AccountDisplayName, AccountObjectId, AccountUPN, AppDisplayName, IPAddress

Remember that once you join your IdentityInfo table to whichever other data sources, you can include fields from both in your queries – so on premise SID’s or ObjectID’s as well as items from your SigninLogs or SecurityAlert tables like alert names, or conditional access failures.

Enforce PIM compliance with Azure Sentinel and Playbooks — 26th Jul 2021

Enforce PIM compliance with Azure Sentinel and Playbooks

Azure AD Privileged Identity Management is a really fantastic tool that lets you provide governance around access to Azure AD roles and Azure resources, by providing just in time access, step up authentication, approvals and a lot of great reporting. For those with Azure AD P2 licensing, you should roll it out ASAP. There are plenty of guides on deploying PIM, so I won’t go back over those, but more focus on how we can leverage Azure Sentinel to make sure the rules are being followed in your environment.

PIM actions are logged to the AuditLogs table, you can find any operations associated by searching for PIM

AuditLogs
| summarize count() by OperationName
| where OperationName contains "PIM"

If you have had PIM enabled for a while, you will see lot of different activities, I won’t list them all here, but you will see each time someone activates a role, when they are assigned to roles, when new roles are onboarded and so on. Most of the items will just be business as usual activity and useful for auditing but nothing we need to alert on or respond to. One big gap of PIM is that users can still be assigned roles directly, so instead of having just in time access to a role, or require an MFA challenge to activate they are permanently assigned to roles – this may not be an issue for some roles like Message Center Reader, but you definitely want to avoid it for highly privileged roles like Global Administrator, Exchange Administrator, Security Administrator and whichever else you deem high risk. This could be an admin trying to get around policy or something more sinister.

Thankfully we get an operation each time this happens, ready to to act on. We can query the AuditLogs for these events, then retrieve the information about who was added to which role, and who did it in case we want to follow up with them. For this example I added our test user to the Power Platform Administrator role outside of PIM.

AuditLogs
| where OperationName startswith "Add member to role outside of PIM"
| extend AADRoleDisplayName = tostring(TargetResources[0].displayName)
| extend AADRoleId = tostring(AdditionalDetails[0].value)
| extend AADUserAdded = tostring(TargetResources[2].displayName)
| extend AADObjectId = tostring(TargetResources[2].id)
| extend UserWhoAdded = tostring(parse_json(tostring(InitiatedBy.user)).userPrincipalName)
| project TimeGenerated, OperationName, AADRoleDisplayName, AADRoleId, AADUserAdded, AADObjectId, UserWhoAdded

If you don’t want to automatically remediate all your roles, you could put the ones you want to target into a Watchlist and complete a lookup on that first. The role names and role ids are the same for all Azure AD tenants, so you can get them here. Create a Watchlist, in this example called PrivilegedAADRoles with the names and ids of the ones you wish to monitor and remediate. Then just query on assignments to groups in your Watchlist.

Now we can include being in that Watchlist as part of the logic we will use when we write our query. Keep in mind you will still get logs for any assignments outside of PIM, we are just limiting the scope here for our remediation.

let AADRoles = (_GetWatchlist("PrivilegedAADRoles")|project AADRoleId);
AuditLogs
| where OperationName startswith "Add member to role outside of PIM"
| extend AADRoleDisplayName = tostring(TargetResources[0].displayName)
| extend AADRoleId = tostring(AdditionalDetails[0].value)
| extend AADUserAdded = tostring(TargetResources[2].displayName)
| extend AADObjectId = tostring(TargetResources[2].id)
| extend UserWhoAdded = tostring(parse_json(tostring(InitiatedBy.user)).userPrincipalName)
| where AADRoleId in (AADRoles)
| project OperationName, AADRoleDisplayName, AADRoleId, AADUserAdded, AADObjectId, UserWhoAdded

Now to address these automatically. First, let’s create our playbook that will automatically remove any users who were assigned outside of PIM. You can call it whatever makes sense for you, now much like the example here, if you want to do your secrets management in an Azure Key Vault, then assign the new logic app rights to read secrets. The service principal you use for this automation will need to be able to manage membership of Global Administrators, so will therefore need to be one itself, so make sure you keep your credentials for it safe.

We want the trigger of our playbook to be ‘When Azure Incident creation rule was triggered’. Then the first thing we are going to do is create a couple of variables, one for the role id that was changed and one for the AAD object id for the user who was added. We will map these through using entity mapping when we create our analytics rule in Sentinel – which we will circle back on and create once our playbook is built. Let’s retrieve the entities from our incident – for this example we will map RoleId to hostname and object id for the user to AADUserID.

Then we grab our AADUserId and RoleId from the entities and append them to our variables ready to re-use them.

Next we use the Key Vault connect to grab our client id, tenant id and client secret from Key Vault, then we are going to POST to the MS Graph to retrieve an access token to re-use as authorization to remove the user.

We will need to parse the JSON response to then re-use the token as authorization, the schema is

{
    "properties": {
        "access_token": {
            "type": "string"
        },
        "expires_in": {
            "type": "string"
        },
        "expires_on": {
            "type": "string"
        },
        "ext_expires_in": {
            "type": "string"
        },
        "not_before": {
            "type": "string"
        },
        "resource": {
            "type": "string"
        },
        "token_type": {
            "type": "string"
        }
    },
    "type": "object"
}

Now we have proven we have access to remove the user who was added outside of PIM, we will POST back to MS Graph using the ‘Remove directory role member’ action outlined here. As a precautionary step, we will revoke the users sessions so if they had a session open with added privileged it has now been logged out. You can also add some kind of notification here, maybe raise an incident in Service Now, or email the user telling them they have had their role removed and inform them about your PIM policies.

To round out the solution, we create our Analytics rule in Sentinel, this is one I would run as often as possible because you want to revoke that access ASAP. So if you run it every 5 minutes, looking at the last 5 minutes of data, then complete the entity mapping outlined below, to match our playbook entities.

When we get to Automated response, create a new incident automation rule that runs the playbook we just built. Then activate the analytics rule.

Now you can give it a test if you want, add someone to a role outside of PIM, within ~10 minutes (to allow the AuditLogs to stream to Azure Sentinel, then your Analytics rule to fire), they should be removed and be logged back out of Azure AD.